Whites Writing Whiteness Google Analytics Data Report: 1 July – 31 December 2019
This report contains provisional information about WWW website use for the particular time-period covered. It has been compiled from Google Analytics data, and will be subject to in-depth comparative analysis at a later stage.
Changes from the Last Report
In comparing user and traffic data from the Whites Writing Whiteness website with the previously reported period (1 January 2019 – 30 June 2019), pleasing developments continue to be apparent. Firstly, the number of new users visiting the website has increased by 0.74% (from 542 to 546 respectively). Secondly, the number of returning users has also increased by 1.09% (from 550 to 556 respectively), indicating stable but still increasing engagement across both habitual users of the website and more recent visitors. Overall for this reported period, users of the website are based in 302 cities and 65 countries around the world (versus 279 cities in 59 countries for the previous period).
The Six Month Report
The WWW website was visited by 556 unique users between 1 July 2019 and 31 December 2019. The site was accessed 947 times, from 65 countries, with the top ten countries in terms of numbers of users being the UK, the USA, South Africa, Germany, Australia, Nepal, Canada, Sweden, the Netherlands and France respectively, and with a strong pattern of visits from other countries including the Indonesia, Romania, Zimbabwe, Ireland, Norway, Switzerland, Italy, Malaysia and the United Arab Emirates.
The site continues to have users who repeatedly visit the site, and many who spend much longer than average looking at its pages. Particularly prolific repeat users in this time-period have accessed the site from South Africa, the UK, the USA, including some habitual users from London, New York, Johannesburg, Birmingham, Kathmandu, Cape Town, Edinburgh, Glasgow, Pretoria and Bristol. For more detailed information, please see Table 6.
Users view many pages per visit, and overall there have been 2,067 page views in total.
Regarding how frequently users return to the site, there have been between 25 and 50 visits to the site by 43 users, between 101 and 200 visits to the site by 62 users, and more than 200 visits to the site by 23 users. These data continue to indicate a serious research use by a large, and in this period 200+ in-depth number of users, with the most-used pages being those concerned with verbatim transcribed letters and documents, and containing detailed analytical discussion. It continues to be very pleasing that users are responding so positively to the most research-rich aspects of the website pages.
Concerning the length of users’ sessions, some 60 users have spent between 3 and 10 minutes browsing the website, 50 users have spent between 10.1-30 minutes, and 10 users spent more than 31 minutes. The average number of such in-depth users visiting the site per month is usually over 90 and sometimes over 110.
| Breakdown of Site Usage by Month: 1 July 2019 – 31 December 2019 | ||||
| Users | Pageviews | Avg. visit duration (mins) | Freq. visitor countries | |
| July | 70 | 229 | 01:29 | 16 |
| August | 98 | 343 | 01:51 | 30 |
| September | 104 | 331 | 01:44 | 28 |
| October | 109 | 345 | 01:31 | 27 |
| November | 116 | 421 | 01:52 | 30 |
| December | 91 | 398 | 02:15 | 28 |
The most-accessed page after the homepage is the project’s weekly ‘Blog’. The project blog contains a mixture of theoretical, methodological and analytical discussions in addition to project updates, and many users continue to follow these weekly discussions. There are a number of related facilities which have been designed to support research use, and it is again very pleasing that these are as effective as they are. For instance, the ‘Traces’ and ‘Curiosities’ area of the website, which provides in-depth analyses of particular documents, continues to be widely read and used by readers. Additionally, the ‘Thinking with Elias’ and ‘Collections’ (providing detailed information about collections worked with) areas continue to be highly popular destinations for website visitors.
In addition to tracking use of the WWW pages via Google Analytics, email contacts and traffic arising from more one-off enquiries are also logged. In this current period, a continued volume of enquiries have been fielded. As previously, these are a combination of family history enquiries, requests for expert advice or opinion, and the provision of information about secondary analysis/use. Notable email correspondence over this period has occurred in particular regarding the murder of the Xhosa ruler Hintsa and the provision of a family history/apologia written by George Southey, the man concerned; and on the complexities of how racial categorisation has played out over time in South Africa.
User Traffic
The majority of users (82.2%) visit the website by organic search via Google and other search engines. Many users (14.6%) also find the website by direct link, or via referrals from other websites (2.6%).
Where users access the site from, and how often:
Tables 1 through 5 below present geographical images show the frequency of website usage for this reported period. These indicate number of visits to the website by saturation of blue ranging from light blue (fewer sessions) to dark blue (the most sessions), and the range in the bottom left corner indicates the lower and upper bound of sessions for this period according to continent (Table 1), sub-continent (Table 2), and sub-regions (Tables 3-5).
Table 1. Number of Visits by Continent

Above, the range spans from 22 sessions (Oceania) to 654 sessions (Europe), and indicates via darkening shades of blue that the most users accessed the website from Europe for this reported period.
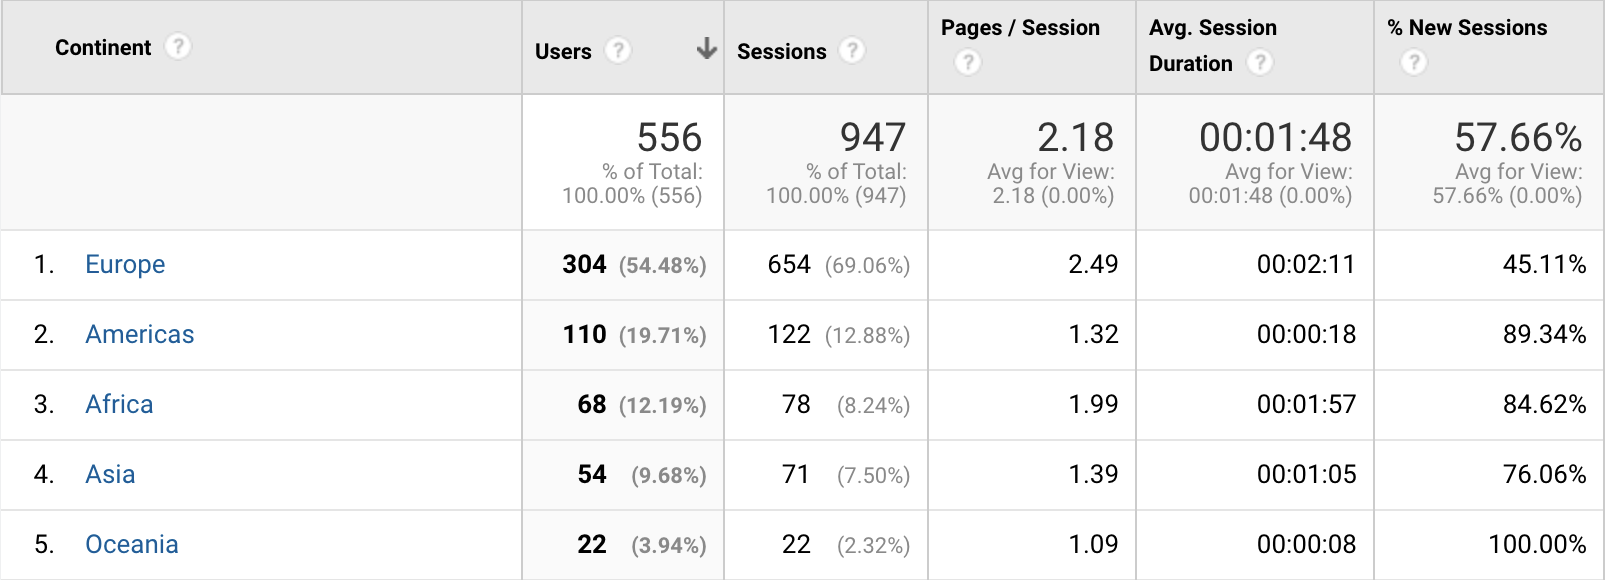
The data above demonstrate that the majority of Whites Writing Whiteness website users access the website from Europe (54.48%), the Americas (19.7%), and Africa (12.2%), and that users from Europe and Africa tend to spend the most time on the website.
Table 2. Number of Visits by Sub-Continent Region

Above, the range spans from 1 session (Central Asia, not pictured) to 553 sessions (Northern Europe), and indicates via darkening shades of blue that the most users accessed the website from Northern Europe for this reported period.

The data above demonstrate that the majority of Whites Writing Whiteness website users access the website from Northern Europe (41.5%), Northern America (18.1%) and Southern Africa (9.3%), and that users from Western Africa (4:56 mins, not pictured) and Eastern Europe tend to spend the most time on the website.
Table 3. Number of Users by Sub-Region – South Africa
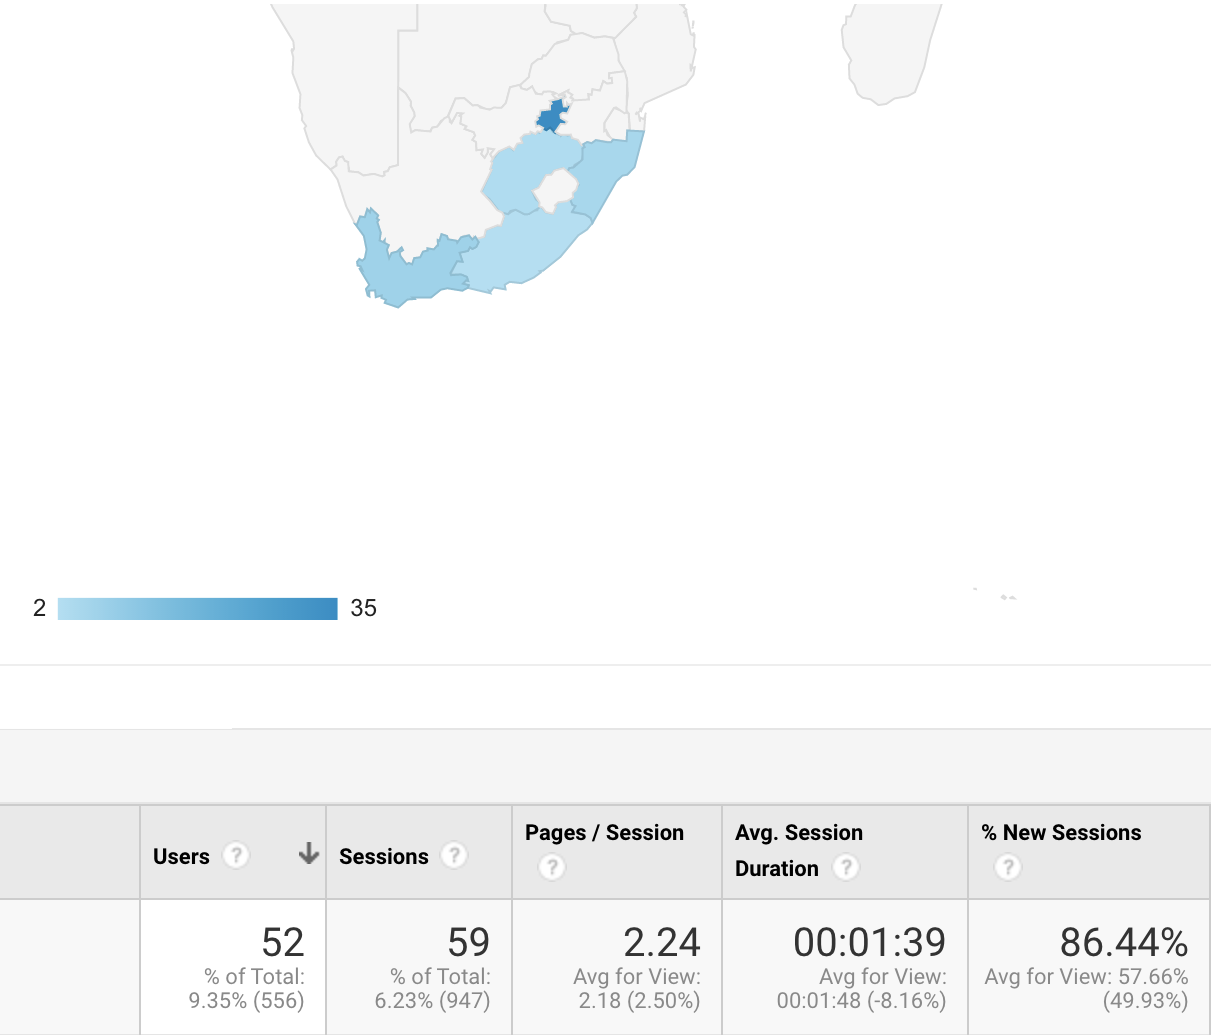
Above, the range spans from 3 sessions (the Eastern Cape) to 37 sessions (Gauteng), and indicates via darkening shades of blue that the most users accessed the website from the Gauteng for this reported period.

The data above demonstrate that the majority of Whites Writing Whiteness website users access the website from Gauteng (67.3%), the Western Cape (13.5%), and the KwaZulu-Natal (9.6%) regions, and that users from the North West and Gauteng regions tend to spend the most time on the website.
Table 4. Number of Users by Sub-Region – United States

Above, the range spans from 1 session (Alabama, not pictured) to 16 sessions (New York), and indicates via darkening shades of blue that the most users accessed the website from New York for this reported period.

The data above demonstrate that the majority of Whites Writing Whiteness website users access the website from the states of New York (17.5%), California (10.2%), and Texas (also 10.2%), and users from Connecticut (not pictured, 14:06) and Georgia tend to spend the most time on the website.
Table 5. Number of Views by Sub-Region – UK

Above, the range spans from 1 session (not set) to 409 sessions (England), and indicates via darkening shades of blue that the most users accessed the website from England for this reported period.

The data above demonstrate that the majority of Whites Writing Whiteness website users access the website from England (78.7%), Scotland (15.9%) and Wales (3.8%), and that users from England and Scotland tend to spend the most time on the website.
| Table 6: Cities, Number of Visits and Pages Accessed | ||||
| The data below show, by city, the number of visits, number of pages accessed on average and the average duration spent on the site, respectively. N.B. asterisks denote particularly intense site usage and/or high numbers of visits. | ||||
| Country | City | Visits | Pages accessed | Avg. visit duration (mins) |
| UK
(10 of 84) |
Lancaster | 207* | 3.99* | 03:19* |
| London | 68* | 1.99 | 02:39* | |
| Edinburgh | 51* | 3.18* | 02:09 | |
| (not set) | 25 | 2.24 | 01:29 | |
| Birmingham | 16 | 2.12 | 02:55* | |
| Dundee | 12 | 2.17 | 02:02 | |
| Glasgow | 12 | 1.83 | 01:09 | |
| Bristol | 6 | 2.83* | 04:10* | |
| Bournemouth | 4 | 1.00 | 00:00 | |
| Leeds | 4 | 1.75 | 00:33 | |
| USA
(10 of 69) |
New York | 12* | 1.17 | 00:02 |
| Atlanta | 5* | 1.60* | 00:06 | |
| Alhambra | 4 | 1.00 | 00:00 | |
| Charlotte | 3 | 1.00 | 00:00 | |
| Austin | 3 | 1.00 | 00:00 | |
| Los Angeles | 2 | 1.00 | 00:00 | |
| Bridgeport | 2 | 11.00 | 14:06* | |
| Newburgh | 2 | 1.00 | 0:00 | |
| Randolph | 2 | 1.00 | 00:00 | |
| Portland | 2 | 1.00 | 00:00 | |
| Australia
(9 of 9) |
Melbourne | 5* | 1.40* | 00:35 |
| Sydney | 4* | 1.00 | 00:00 | |
| (not set) | 1 | 1.00 | 00:00 | |
| Canberra | 1 | 1.00 | 00:00 | |
| Lismore | 1 | 1.00 | 00:00 | |
| Brisbane | 1 | 1.00 | 00:00 | |
| Adelaide | 1 | 1.00 | 00:00 | |
| Gold Coast | 1 | 1.00 | 00:00 | |
| Perth | 1 | 1.00 | 00:00 | |
| South Africa
(10 of 18) |
Johannesburg | 10* | 3.80* | 01:58 |
| Pretoria | 10* | 1.30 | 00:04 | |
| Cape Town | 8* | 1.00 | 00:00 | |
| Sandton | 7 | 4.00* | 01:50 | |
| Howick | 4 | 2.25 | 03:55* | |
| Port Elizabeth | 2 | 1.00 | 00:00 | |
| Bloemfontein | 2 | 3.00* | 01:28 | |
| Centurion | 2 | 2.00 | 10:45* | |
| Germiston | 2 | 1.00 | 00:00 | |
| Randburg | 2 | 1.00 | 00:00 | |
Last updated: 6 February 2020

![]()