Whites Writing Whiteness Google Analytics Data Report: 1 January – 30 June 2021
This report contains provisional information about WWW website use for the time-period it covers. It has been compiled from Google Analytics data, and will be subject to in-depth comparative analysis at a later stage.
Changes from the Last Report
The coronavirus pandemic world-wide has obviously had many profound effects. This has included the shutting of libraries, reading rooms and other places of documentary and archival research. Such changes have in turn placed greater significance on digital research and supporting analytical resources of the kind found on the Whites Writing Whiteness website. Giving evidence to this view, the WWW website has seen a marked general increase in user traffic and an increase in in-depth use, as itemised in this report, which covers the first four months in which the pandemic had effect.
In comparing user and traffic data from the Whites Writing Whiteness website with the previously reported period (1 July 2020 – 31 December 2020), several in the circumstances pleasing developments are apparent. Firstly, the number of visits has risen 38.26% (from 1,150 to 1,590 respectively). Secondly, the number of page views has risen 27.31% (from 2,171 to 2,764 pages) — with these users based in 77 countries and 363 cities around the world (versus 515 cities in 76 countries for the previous period). Thirdly, the number of users visiting the website has risen by 45.52% (from 815 to 1,186 respectively). The fact that website use continues to rise is extremely encouraging, and analysis of the details of its usage indicates that this is related to the regular posting of research-rich materials and of the research tools needed to investigate and analyse these, with these materials being picked up by a very wide range of both popular and academic users.
The Six Month Report
The WWW website was visited by 1,185 unique users between 1 January 2021 and 30 June 2021. The site was accessed 1,590 times, from 77 countries, with the top ten countries in terms of number of users being the UK, South Africa, the USA, Germany, Canada, Ireland Australia, India, Nepal and Nigeria respectively, and with significant visits from other countries including Zimbabwe, the Netherlands, Sweden and Denmark. The site continues to have a group of users who repeatedly visit the site, and many of these spend much longer than average looking at its pages. Particularly prolific repeat users access the site from South Africa, the UK, the USA, including some habitual users from London, Johannesburg, Cape Town, Pretoria, Sandton, Berea, Durban, Lancaster and Edinburgh. For more detailed information, see Table 6.
Users view many pages per visit, with an average of 1 (1.74) pages viewed each visit. Overall, there have been 2,764 page views in total. There have been 173 habitual users, spending detailed time on an average of 2 (2.30) pages per visit, while the 1,175 new users view an average of 2 (1.54) pages.
Regarding how frequently users return to the site, there have been 2 visits to the site by 164 users, between 15 and 25 visits to the site by 24 users, and between 101 and 200 visits to the site by 88 users. These data indicate a serious research use by a significant group of some 200+ in-depth users, with the corresponding most-used pages presenting verbatim transcribed letters and documents, and containing detailed analytical discussion. It is very pleasing that users are responding so positively to the most research-rich aspects of the website pages and that this has continued over a long period of the website’s existence.
Concerning length of users’ sessions, 70 users have spent between 3 and 10 minutes browsing the website, 61 users have spent between 10-30 minutes, and 9 users spent more than 31 minutes. The average number of users visiting the site per month is usually over 180 and sometimes over 200.
| Breakdown of Site Usage by Month: 1 January 2021 – 30 June 2021 | ||||
| Users | Pageviews | Avg. visit duration (mins) | Freq. visitor countries | |
| January | 177 | 492 | 1:41 | 35 |
| February | 181 | 353 | 1:16 | 30 |
| March | 192 | 403 | 1:15 | 31 |
| April | 225 | 534 | 1:00 | 35 |
| May | 259 | 596 | 1:27 | 30 |
| June | 192 | 386 | 1:07 | 32 |
The most-accessed page after the homepage is the project ‘Blog’. The project blog contains largely theoretical discussions in addition to project updates, and many users continue to follow these discussions. There are a number of facilities which have been designed to support research use, and it is very pleasing that these are as effective as they are. For instance, the ‘Traces’ area of the website, which provides in-depth analyses of particular documents, continues to be widely read and used by readers. Additionally, the ‘Thinking with Elias’ area (launched in the spring of 2016) and the ‘Collections’ (providing detailed information about collections worked with) areas continue to be highly popular destinations for website visitors.
Notable email correspondence to report over this period has concerned establishing the history of early Johannesburg through letters and diaries, stemming from a request made by the senior history teacher from a well-known Johannesburg school.
As commented in previous reports, in addition to tracking use of the WWW pages via Google Analytics, email contacts and traffic arising from more one-off enquiries are also logged. In this current period, over 20 such enquiries have been fielded. These have been a combination of family history enquiries, requests for expert advice, the provision of information about secondary analysis/use, and one-off requests for information concerning WWW letter-writers.
User Traffic
The majority of users (79.1%) visit the website through organic searches via Google and other search engines. Many users (18.4%) also find the website via direct link, or by referrals from other websites (2.5%).
Where users access the site from, and how often:
Tables 1 through 5 below present geographical images show the frequency of website usage for this reported period. These indicate number of visits to the website by saturation of blue ranging from light blue (fewer sessions) to dark blue (the most sessions), and the range in the bottom left corner indicates the lower and upper bound of sessions for this period according to continent (Table 1), sub-continent (Table 2), and sub-regions (Tables 3-5).
Table 1. Number of Visits by Continent

Above, the range spans from 2 sessions ([not set]) to 783 sessions (Europe), and indicates via darkening shades of blue that the most users accessed the website from Europe for this reported period.
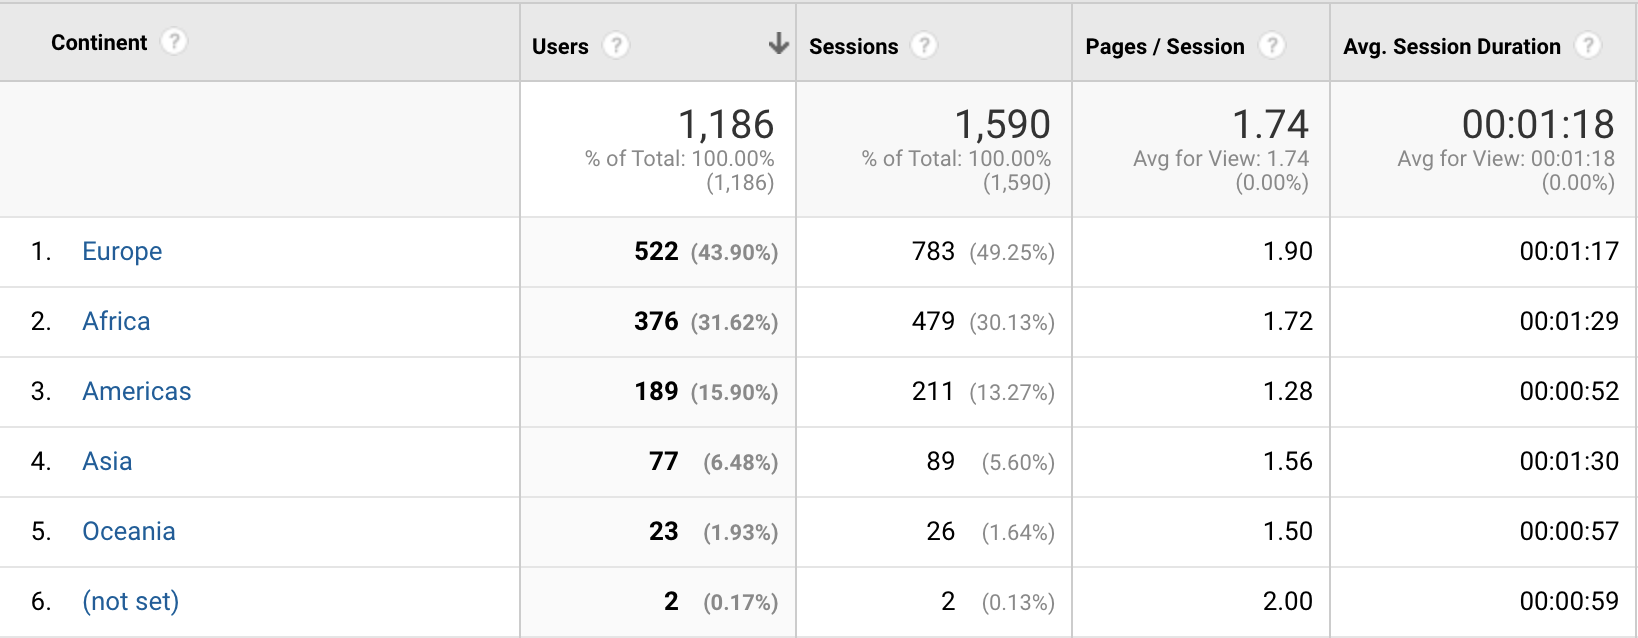
The data above demonstrate that the majority of Whites Writing Whiteness website users access the website from Europe (43.9%), Africa (31.6%), and the Americas (15.9%), and that users from Africa and Asia tend to spend the most time on the website.
Table 2. Number of Visits by Sub-Continent Region

Above, the range spans from 1 session (Middle Africa [not pictured]) to 679 sessions (Northern Europe), and indicates via darkening shades of blue that the most users accessed the website from Northern Europe for this reported period.

The data above demonstrate that the majority of Whites Writing Whiteness website users access the website from Northern Europe (36.5%), Southern Africa (27.4%), Northern America (14.9%), and that users from Eastern and Western Asia [not pictured] tend to spend the most time on the website.
Table 3. Number of Users by Sub-Region – South Africa

Above, the range spans from 2 sessions (Northern Cape) to 231 sessions (Gauteng), and indicates via darkening shades of blue that the most users accessed the website from the Gauteng for this reported period.

The data above demonstrate that the majority of Whites Writing Whiteness website users access the website from the Gauteng (54%), KwaZulu-Natal (19.6%), and the Western Cape (17.74%) regions, and that users from the Eastern and Western Cape regions tend to spend the most time on the website.
Table 4. Number of Users by Sub-Region – United States

Above, the range spans from 1 session (Alaska [not pictured]) to 23 sessions (California), and indicates via darkening shades of blue that the most users accessed the website from Connecticut for this reported period.

The data above demonstrate that the majority of Whites Writing Whiteness website users access the website from the states of California (13.2%), Texas (7.55%), and Florida (6.3%), and users from Arizona (not pictured [12:17 mins]) and Oklahoma ([5:07]) tend to spend the most time on the website.
Table 5. Number of Views by Sub-Region – UK

Above, the range spans from 3 sessions ([not set]) to 558 sessions (England), and indicates via darkening shades of blue that the most users accessed the website from England for this reported period.

The data above demonstrate that the majority of Whites Writing Whiteness website users access the website from England (85.6%) and Scotland (9.9%), and that users from England and [not set] tend to spend the most time on the website.
| Table 6: Cities, Number of Visits and Pages Accessed | |||||
| The data below show, by city, the number of visits, number of pages accessed on average and the average duration spent on the site, respectively. N.B. asterisks denote particularly intense site usage and/or high numbers of visits. | |||||
| Country | City | Visits | Pages accessed | Avg. visit duration (mins) | |
| UK
(10 of 143) |
London | 105* | 2.30* | 02:23* | |
| (not set) | 32* | 2.34* | 01:56 | ||
| Lancaster | 146* | 3.00* | 02:06* | ||
| Edinburgh | 15 | 1.60 | 00:46* | ||
| Birmingham | 14 | 114 | 01:08 | ||
| Manchester | 9 | 1.33 | 00:09 | ||
| Nottingham | 9 | 4.25* | 00:03 | ||
| Exeter | 8 | 1.22 | 00:00 | ||
| Croydon | 7 | 1.00 | 01:15 | ||
| Liverpool | 8 | 2.14* | 00:19 | ||
| USA
(10 of 124) |
Roseville | 11* | 1.00 | 00:00 | |
| (not set) | 9 | 1.22* | 01:50* | ||
| Boston | 6 | 1.00 | 00:00 | ||
| New York | 4 | 1.00 | 00:00 | ||
| Chicago | 3 | 1.00 | 00:00 | ||
| Houston | 3 | 1.00 | 00:00 | ||
| San Francisco | 2 | 1.00 | 00:00 | ||
| West Haven | 3 | 1.00 | 00:00 | ||
| Washington | 2 | 1.00 | 00:00 | ||
| North Miami Beach | 2 | 1.00 | 00:00 | ||
| Australia
(7 of 7) |
Sydney | 4 | 1.00 | 00:00 | |
| Melbourne | 7 | 1.00 | 00:00 | ||
| Brisbane | 2 | 1.00 | 00:00 | ||
| Perth | 2 | 1.00 | 00:00 | ||
| Adelaide | 1 | 4.00* | 10:11 | ||
| Hobart | 1 | 2.00* | 08:24 | ||
| (not set) | 1 | 1.00 | 00:00 | ||
| South Africa
(10 of 47) |
Johannesburg | 70* | 1.91 | 01:35 | |
| Cape Town | 65* | 2.03* | 01:49 | ||
| Pretoria | 46* | 1.54 | 01:13 | ||
| Sandton | 45 | 1.62 | 01:38 | ||
| Berea | 39 | 1.46 | 00:34 | ||
| Durban | 21 | 2.10 | 00:51 | ||
| Roodepoort | 19 | 1.16 | 00:51 | ||
| Gqeberha | 15 | 1.27 | 02:20* | ||
| Centurion | 12 | 1.17 | 00:04 | ||
| Pietermaritzburg | 9 | 2.78 | 04:22* | ||
Last updated: 22 July 2021

![]()