Whites Writing Whiteness Google Analytics Data Report: 1 January – 30 June 2020
This report contains provisional information about WWW website use for the particular time-period it covers. It has been compiled from Google Analytics data, and will be subject to in-depth comparative analysis at a later stage.
Changes from the Last Report
The coronavirus pandemic world-wide has obviously had many profound effects. This has included the shutting of libraries, reading rooms and other places of documentary research. Such changes have in turn placed greater significance on digital research and supporting analytical resources of the kind found on the Whites Writing Whiteness website. Giving evidence to this view, the WWW website has seen a marked general increase in user traffic and an increase in in-depth use, as itemised in this report, which covers the first four months in which the pandemic had effect.
In comparing user and traffic data from the Whites Writing Whiteness website with the previously reported period (1 July 2019 – 31 December 2019), several in the circumstances pleasing developments are apparent. Firstly, the number of visits has risen 10.35% (from 947 to 1,045 respectively). Secondly, the number of pages users view in an average session has risen 5.9% (from 2.2 to 2.3 pages) — with these users based in 68 countries and 363 cities around the world (versus 301 cities in 65 countries for the previous period). Thirdly, the average time visitors spend viewing pages has risen significantly by 29.7% (from 1:48 to 2:19 mins respectively). The fact that website use continues to rise is extremely encouraging, and analysis of the details of its usage indicates that this is related to the regular posting of research-rich materials and of the research tools needed to investigate and analyse these, with these materials being picked up by a very wide range of both popular and academic users.
The Six Month Report
The WWW website was visited by 658 unique users between 1 January 2020 and 30 June 2020. The site was accessed 1,045 times, from 68 countries, with the top ten countries in terms of number of users being the UK, the USA, South Africa, Canada, Australia, Germany, Spain, India, Ireland and Italy respectively, and with significant visits from other countries including Nigeria, Denmark, Japan Sweden, Indonesia, Turkey, the Philippines, France, and the Netherlands. The site continues to have a group of users who repeatedly visit the site, and many of these spend much longer than average looking at its pages. Particularly prolific repeat users access the site from South Africa, the UK, the USA, including some habitual users from Lancaster, London, Edinburgh, Sandton, Cape Town, Johannesburg, New York, and Cambridge. For more detailed information, please see Table 6.
Users view many pages per visit, with an average of 2 (2.31) pages viewed each visit. Overall, there have been 2,416 page views in total. There have been 89 habitual users, spending detailed time on an average of 3 (3.45) pages per visit, while the 652 new users view an average of 2 (1.57) pages.
Regarding how frequently users return to the site, there have been 2 visits to the site by 85 users, between 26 and 50 visits to the site by 46 users, between 101 and 200 visits to the site by 23 users, and more than 200 visits to the site by 79 users. These data indicate a serious research use by a significant group of some 200+ in-depth users, with the corresponding most-used pages presenting verbatim transcribed letters and documents, and containing detailed analytical discussion. It is very pleasing that users are responding so positively to the most research-rich aspects of the website pages and that this has continued over a long period of the website’s existence.
Concerning length of users’ sessions, 78 users have spent between 3 and 10 minutes browsing the website, 55 users have spent between 10-30 minutes, and 19 users spent more than 31 minutes. The average number of users visiting the site per month is usually over 145 and sometimes over 200.
| Breakdown of Site Usage by Month: 1 January 2020 – 30 June 2020 | ||||
| Users | Pageviews | Avg. visit duration (mins) | Freq. visitor countries | |
| January | 165 | 474 | 3:20 | 26 |
| February | 199 | 452 | 2:08 | 26 |
| March | 146 | 296 | 1:17 | 27 |
| April | 149 | 413 | 3:29 | 27 |
| May | 167 | 311 | 1:28 | 23 |
| June | 219 | 470 | 2:18 | 36 |
The most-accessed page after the homepage is the project ‘Blog’. The project blog contains largely theoretical discussions in addition to project updates, and many users continue to follow these discussions. There are a number of facilities which have been designed to support research use, and it is very pleasing that these are as effective as they are. For instance, the ‘Traces’ area of the website, which provides in-depth analyses of particular documents, continues to be widely read and used by readers. Additionally, the ‘Thinking with Elias’ area (launched in the spring of 2016) and the ‘Collections’ (providing detailed information about collections worked with) areas continue to be highly popular destinations for website visitors.
Notable email correspondences to report over this period has concerned a new popular edition of Olive Schreiner’s Dreams and calling upon the expertise of the Oliver Schreiner Letters Online project on a range of related matters.
From a previous report: In addition to tracking use of the WWW pages via Google Analytics, email contacts and traffic arising from more one-off enquiries are also logged. In this current period, over 20 such enquiries have been fielded. These are a combination of family history enquiries, requests for expert advice or opinion, the provision of information about secondary analysis/use, and a series of repeat requests for information concerning the early publications of one of the letter-writers.
User Traffic
The majority of users (80.4%) visit the website through organic searches via Google and other search engines. Many users (16.1%) also find the website via direct link, or by referrals from other websites (3.4%).
Where users access the site from, and how often:
Tables 1 through 5 below present geographical images show the frequency of website usage for this reported period. These indicate number of visits to the website by saturation of blue ranging from light blue (fewer sessions) to dark blue (the most sessions), and the range in the bottom left corner indicates the lower and upper bound of sessions for this period according to continent (Table 1), sub-continent (Table 2), and sub-regions (Tables 3-5).
Table 1. Number of Visits by Continent

Above, the range spans from 22 sessions (Oceania) to 659 sessions (Europe), and indicates via darkening shades of blue that the most users accessed the website from Europe for this reported period.

The data above demonstrate that the majority of Whites Writing Whiteness website users access the website from Europe (50.7%), the Americas (20.6%), and Africa (16.6%), and that users from Europe and Africa tend to spend the most time on the website.
Table 2. Number of Visits by Sub-Continent Region

Above, the range spans from 3 sessions (Northern Africa [not pictured]) to 553 sessions (Northern Europe), and indicates via darkening shades of blue that the most users accessed the website from Northern Europe for this reported period.

The data above demonstrate that the majority of Whites Writing Whiteness website users access the website from Northern Europe (39.8%), Northern America (18.8%) and Southern Africa (13.4%), and that users from Southern Europe and Eastern Asia tend to spend the most time on the website.
Table 3. Number of Users by Sub-Region – South Africa

Above, the range spans from 2 session (the Free State) to 72 sessions (Gauteng), and indicates via darkening shades of blue that the most users accessed the website from the Gauteng for this reported period.

The data above demonstrate that the majority of Whites Writing Whiteness website users access the website from Gauteng (63.9%), the Western Cape (22.1%), and the KwaZulu-Natal (6.9%) regions, and that users from the Eastern and Western Cape regions tend to spend the most time on the website.
Table 4. Number of Users by Sub-Region – United States
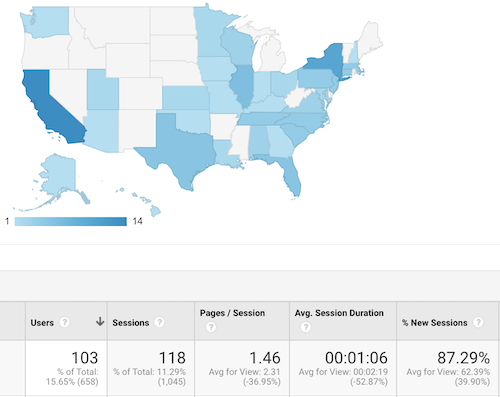
Above, the range spans from 1 session (Alaska [not pictured]) to 14 sessions (California), and indicates via darkening shades of blue that the most users accessed the website from Connecticut for this reported period.

The data above demonstrate that the majority of Whites Writing Whiteness website users access the website from the states of California (13.5%), New York (9.6%), and Illinois (5.7%), and users from Connecticut and Virginia (not pictured [5:48 mins]) tend to spend the most time on the website.
Table 5. Number of Views by Sub-Region – UK

Above, the range spans from 3 sessions (Northern Ireland) to 435 sessions (England), and indicates via darkening shades of blue that the most users accessed the website from England for this reported period.

The data above demonstrate that the majority of Whites Writing Whiteness website users access the website from England (81.5%), Scotland (13.1%) and Wales (4.1%), and that users from Northern Ireland and Scotland tend to spend the most time on the website.
| Table 6: Cities, Number of Visits and Pages Accessed | |||||
| The data below show, by city, the number of visits, number of pages accessed on average and the average duration spent on the site, respectively. N.B. asterisks denote particularly intense site usage and/or high numbers of visits. | |||||
| Country | City | Visits | Pages accessed | Avg. visit duration (mins) | |
| UK
(10 of 106) |
London | 72* | 1.44 | 01:23 | |
| (not set) | 19 | 1.21 | 00:30 | ||
| Edinburgh | 53* | 3.75* | 04:31* | ||
| Lancaster | 214* | 4.14* | 05:38* | ||
| Cambridge | 9 | 1.00 | 00:00 | ||
| Cardiff | 7 | 1.00 | 00:00 | ||
| Glasgow | 4 | 4.25* | 00:00 | ||
| Birmingham | 5 | 1.20 | 00:49 | ||
| Bradford | 3 | 1.00 | 01:15 | ||
| Bristol | 5 | 2.20* | 05:19* | ||
| USA
(10 of 84) |
New York | 10* | 1.00 | 00:00 | |
| (not set) | 4 | 2.75* | 02:40* | ||
| Chicago | 5 | 1.80 | 00:05 | ||
| Washington | 3 | 1.00 | 00:00 | ||
| Los Angeles | 2 | 1.00 | 00:00 | ||
| Monroe | 4 | 5.75* | 17:05* | ||
| Bethesda | 2 | 1.00 | 00:00 | ||
| Jackson Township | 2 | 1.00 | 00:00 | ||
| Columbia | 2 | 1.00 | 00:00 | ||
| Knoxville | 2 | 1.00 | 00:00 | ||
| Australia
(6 of 6) |
Sydney | 8 | 1.00 | 00:00 | |
| Melbourne | 3 | 1.00 | 00:00 | ||
| Perth | 4 | 3.25* | 02:07* | ||
| (not set) | 1 | 1.00 | 00:00 | ||
| Canberra | 1 | 1.00 | 00:00 | ||
| Brisbane | 1 | 4.00* | 01:41 | ||
| Central Coast | 1 | 1.00 | 00:00 | ||
| South Africa
(10 of 22) |
Sandton | 33* | 2.00 | 01:09 | |
| Cape Town | 24* | 3.12* | 03:01* | ||
| Johannesburg | 11* | 2.09 | 01:35 | ||
| Pretoria | 6 | 5.50* | 06:38* | ||
| Roodepoort | 6 | 2.17 | 02:35 | ||
| Centurion | 4 | 1.00 | 00:00 | ||
| Durban | 4 | 2.25 | 00:31 | ||
| Alberton | 4 | 1.25 | 01:49 | ||
| Germiston | 3 | 1.67 | 00:29 | ||
| Port Elizabeth | 2 | 2.50 | 09:46* | ||
Last updated: 15 September 2020

![]()