Whites Writing Whiteness Google Analytics Data Report: 1 July – 31 December 2018
This report contains provisional information about WWW website use for the particular time-period it covers. It has been compiled in a fairly undigested form from Google Analytics data, and may be subject to in-depth comparative analysis at a later stage.
Changes from Last Report
In comparing user and traffic data of the Whites Writing Whiteness website with the previously reported period (1 Jan 2018 – 30 Jun 2018), there are several new developments to report. Firstly, the average time visitors spend browsing the website has risen by 33.7% (from 1:35 to 2:07 respectively). Secondly, the number of pages visitors view during their visits has also risen by 15.6% (from 1.91 to 2.20 respectively). Thirdly, the number of visits per user has risen by 19.6% (from 1.29 to 1.54 respectively).
In addition, the WWW website was unaccountably removed from Google search results for a lengthy time. This occurred for reasons we have not been able to trace, and has had a serious effect on use:
Data:
Jul-Dec 2018: 51 countries, 204 cities
Jan-Jun 2018: 101 countries, 882 cities
Users (visitors): -75.44% (683 vs 2,781)
Sessions (visits): -70.63% (1,055 vs 3,592)
Pageviews: -66.03% (2,325 vs 6,844)
For this six month period only, the majority of users accessed the website via direct link, with only 7.6% of users accessing the website via organic searches (versus the usual 40-70%). For January 2019, so far the numbers appear to be returning to ‘normal’, so this does not seem a persisting problem (for 1-24 Jan: 14.8% via organic search).
The Six Month Report
The WWW website was visited by 683 unique users between 1 July 2018 and 31 December 2018. The site was accessed 1,055 times, from 51 countries, with the top ten countries in terms of number of users being France, the UK, USA, Germany, South Africa, South Korea, Australia, Canada, Iraq and Zimbabwe, and with visits from other countries including the Ukraine, India, Ireland, Nepal, Finland, Poland, Greece, the Netherlands, New Zealand and the Philippines.
The site continues to have users who repeatedly visit the site and many who spend much longer than average looking at its pages. Particularly prolific repeat users for this period access the site from South Africa, Poland, Sweden, Germany, India, Australia, Canada, the Ukraine, the USA and the UK, including some habitual users from Paris, Lancaster, London, Butzbach, Edinburgh, Muju-gun, Wurselen, Harare and Odesa. For more detailed information, please see Table 6.
Users view many pages per visit, with an average of 2 (2.20) pages viewed per visit. Overall, there have been 2,325 page views in total. There have been over 60 habitual users, spending detailed time on average 3 (3.39) pages per visit, while the 676 new users viewed an average of 1 (1.67) pages.
Regarding how frequently users return to the site, there have been 2 visits to the site by 56 users, between 15 and 25 visits to the site by 36 users, between 101 and 200 visits to the site by 61 users, and more than 201 visits to the site by 75 users. These data indicate a serious research use by some 200+ in-depth users, with the corresponding most-used pages presenting verbatim transcribed letters and documents, and containing detailed analytical discussion. This demonstrates a major increase compared with the previous reported period. The average number users visiting the site per month is usually over 80 and sometimes over 180.
Concerning length of users’ sessions, 111 users have spent between 3 and 10 minutes browsing the website, 70 users have spent between 10.1-30 minutes, and just 10 users spent more than 31 minutes.
| Breakdown of Site Usage by Month: 1 July 2018 – 31 December 2018 | ||||
| Users | Pageviews | Avg. visit duration (mins) | Freq. visitor countries | |
| July | 82 | 299 | 1.50 | 19 |
| August | 184 | 503 | 2.50 | 20 |
| September | 103 | 455 | 2.31 | 23 |
| October | 161 | 448 | 1.52 | 25 |
| November | 110 | 311 | 1.47 | 18 |
| December | 77 | 309 | 1.27 | 16 |
The most accessed page after the homepage for this period is the project ‘Blog’, with the ‘Traces’, ‘Thinking with Elias’ and ‘How-to’ areas also highly popular. The project blog contains methodological and theoretical discussion in addition to project updates, and users continue to follow these discussions.
User Traffic
The majority of users visit the website by direct link (48.3%). Many users also find the website via referrals from the Edinburgh University’s website (43.9%) or through organic searches via Google and other search engines (7.6%).
Where users access the site from, and how often:
Tables 1 through 5 below present geographical images show the frequency of website usage for this reported period. These indicate number of visits to the website by saturation of blue ranging from light blue (fewer sessions) to dark blue (the most sessions), and the range in the bottom left corner indicates the lower and upper bound of sessions for this period according to continent (Table 1), sub-continent (Table 2), and sub-regions (Tables 3-5).
Table 1. Number of Visits by Continent
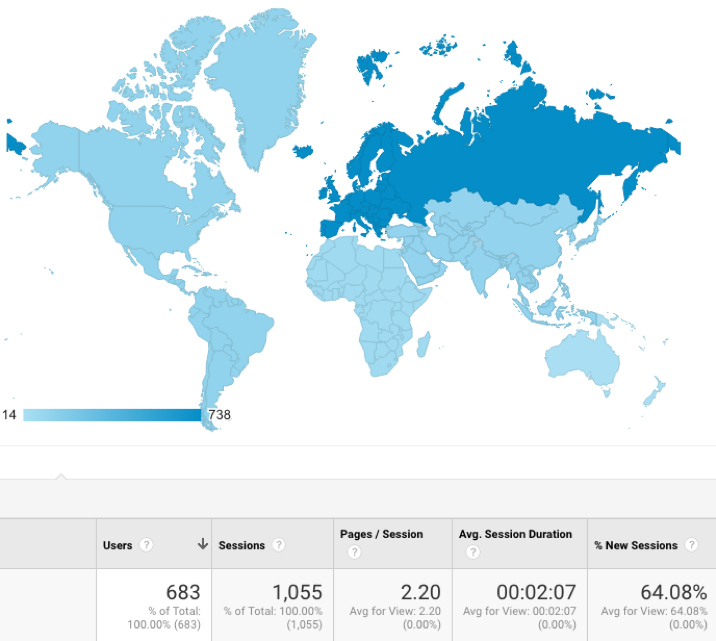
Above, the range spans from 14 sessions (Oceania) to 738 sessions (Europe), and indicates via darkening shades of blue that the most users accessed the website from Europe for this reported period.
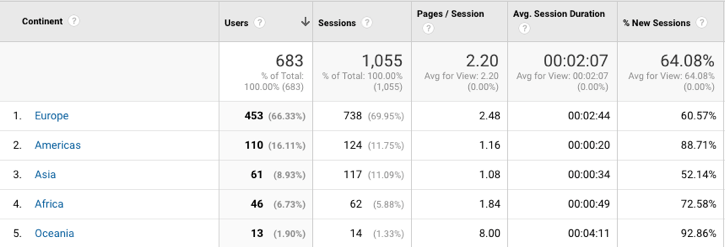
The data above demonstrate that the majority of Whites Writing Whiteness website users access the website from Europe (66.3%), the Americas (16.1%), and Asia (8.9%), and that users from Oceania and Europe tend to spend the most time on the website.
Table 2. Number of Visits by Sub-Continent Region
Above, the range spans from 1 session (Caribbean) to 441 sessions (Northern Europe), and indicates via darkening shades of blue that the most users accessed the website from Western Europe for this reported period.
The data above demonstrate that the majority of Whites Writing Whiteness website users access the website from Western Europe (38.4%), Northern Europe (24.7%) and Northern America (15.3%), and that users from Eastern Europe and Australasia tend to spend the most time on the website.
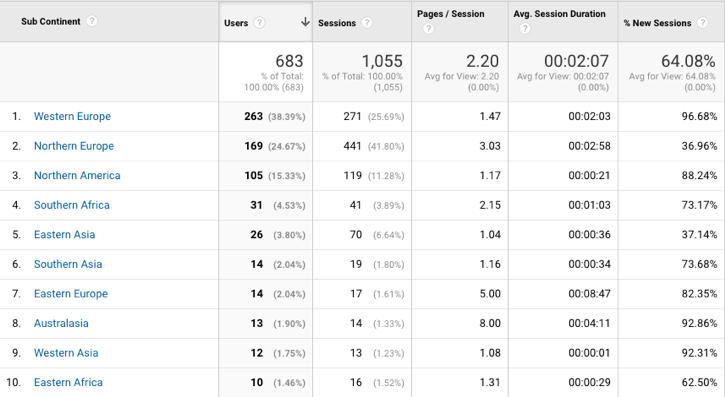
Table 3. Number of Users by Sub-Region – South Africa 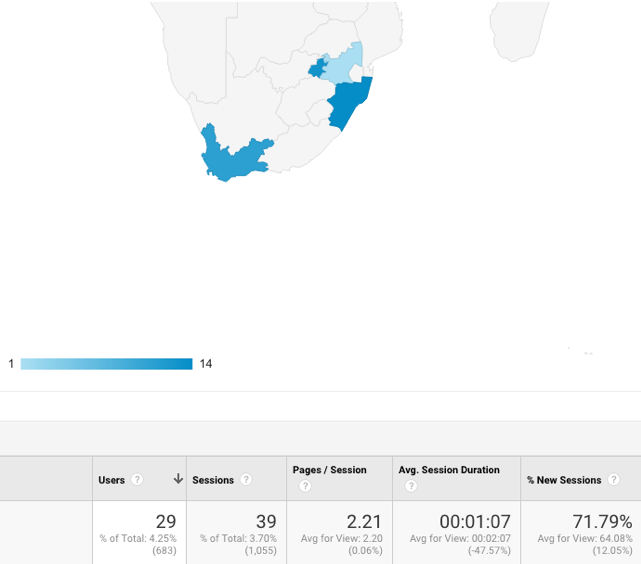
Above, the range spans from 1 session (Mpumalanga) to 14 sessions (KwaZulu-Natal), and indicates via darkening shades of blue that the most users accessed the website from Gauteng for this reported period.
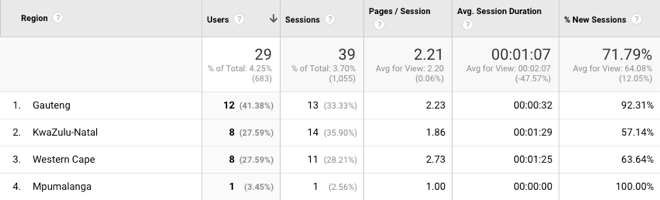
The data above demonstrate that the majority of Whites Writing Whiteness website users access the website from the Gauteng (41.4%), KwaZulu-Natal (27.6%) the Western Cape (27.6%) regions, and that users from the Western Cape and KwaZulu-Natal tend to spend the most time on the website.
Table 4. Number of Users by Sub-Region – United States
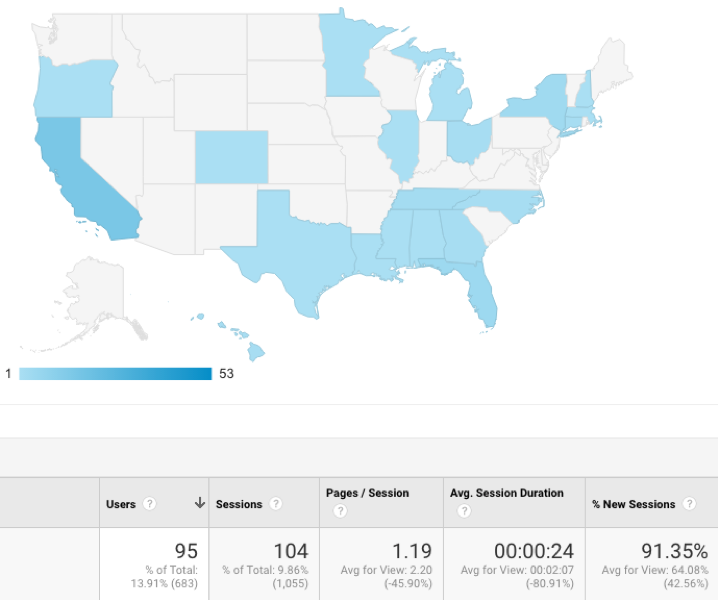
Above, the range spans from 1 session (Washington D. C.) to 53 sessions ((not set)***), and indicates via darkening shades of blue that the most users accessed the website from (not set) and California for this reported period.
***(not set) indicates that location data could not be determined for the associated users. This could mean, for example, that IP addresses were masked or were not made available for data collection because of some other reason.
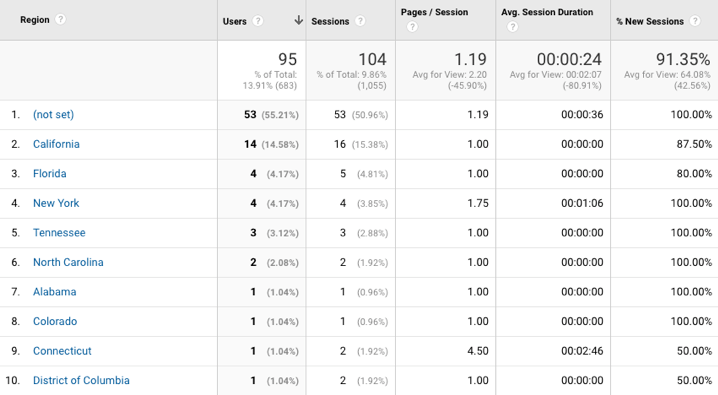
The data above demonstrate that the majority of Whites Writing Whiteness website users access the website from the states of (not set) (55.2%), California (14.6%), and Florida (4.2%), although users from Connecticut and New York tend to spend the most time on the website.
Table 5. Number of Views by Sub-Region – UK
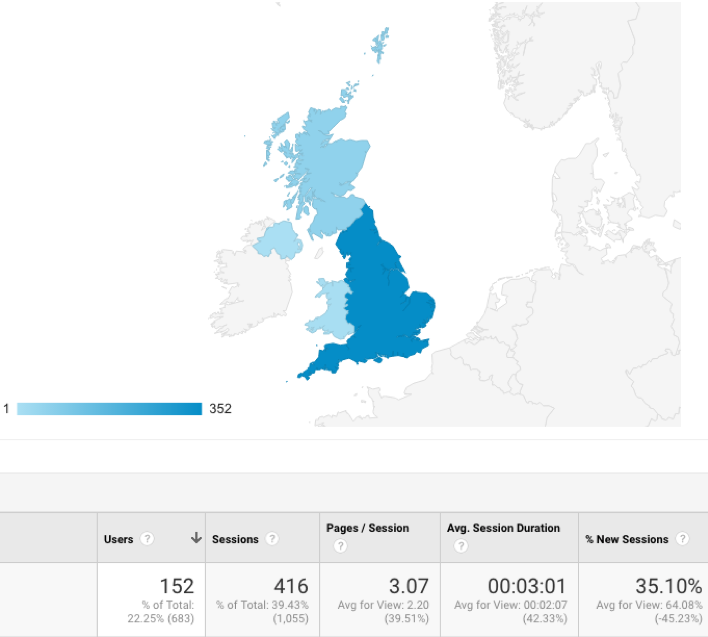
Above, the range spans from 1 session (Northern Ireland) to 352 sessions (England), and indicates via darkening shades of blue that the most users accessed the website from England for this reported period.
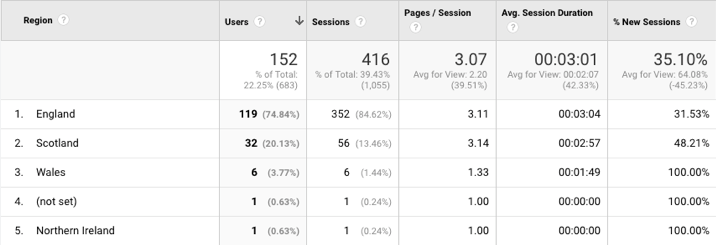
The data above demonstrate that the majority of Whites Writing Whiteness website users access the website from England (74.8%), Scotland (20.1%) and Wales (3.8%) with users from England and Scotland tending to spend the most time on the website.
| Table 6: Cities, Number of Visits and Pages Accessed | ||||
| The data below show, by city, the top numbers of visits, number of pages accessed on average and the average duration spent on the site, respectively. N.B. asterisks denote particularly intense site usage and/or high numbers of visits. | ||||
| Country | City | Visits | Pages accessed | Avg. visit duration (mins) |
| UK
(10 of 71)
|
Lancaster | 126* | 3.07 | 04:35* |
| London | 91* | 2.52 | 01:58 | |
| Edinburgh | 38 | 3.37 | 03:21* | |
| Portsmouth | 17 | 4.29* | 05:20* | |
| Rotherham | 15 | 4.27* | 01:52 | |
| Lowick | 8 | 6.00* | 08:45* | |
| Dundee | 7 | 3.86* | 03:19* | |
| (not set) | 6 | 3.83* | 01:16 | |
| Durham | 6 | 4.83* | 06:38* | |
| Birmingham | 5 | 1.00 | 00:00 | |
| USA
(10 of 30)
|
(not set) | 55* | 1.18 | 00:35* |
| Santa Paula | 8 | 1.00 | 00:00 | |
| Los Angeles | 5 | 1.00 | 00:00 | |
| New York | 4 | 1.75 | 01:06 | |
| Monroe | 2 | 4.50* | 02:46* | |
| Washington DC | 2 | 1.00 | 00:00 | |
| Carrollton | 2 | 1.00 | 00:00 | |
| Honolulu | 2 | 1.00 | 00:00 | |
| Cincinnati | 2 | 1.00 | 00:00 | |
| Knoxville | 2 | 1.00 | 00:00 | |
| Australia
(6 of 6)
|
Melbourne | 5* | 13.20* | 06:50* |
| Sydney | 2 | 1.00 | 00:00 | |
| (not set) | 1 | 1.00 | 00:00 | |
| Wollongong | 1 | 1.00 | 00:00 | |
| Adelaide | 1 | 4.00* | 02:29* | |
| Gold Coast | 1 | 3.00* | 03:06* | |
| South Africa
(10 of 14)
|
Durban | 10* | 2.10 | 02:00* |
| Cape Town | 10* | 2.90* | 01:33 | |
| Sandton | 5 | 1.40 | 00:03 | |
| Johannesburg | 2 | 1.00 | 00:00 | |
| Roodepoort | 2 | 1.00 | 00:00 | |
| Durban North | 2 | 1.00 | 00:00 | |
| Boksburg | 1 | 1.00 | 00:00 | |
| Centurion | 1 | 1.00 | 00:00 | |
| Pretoria | 1 | 3.00* | 01:27 | |
| Vanderbijlpark | 1 | 13.00* | 05:15* | |
Last updated: 13 April 2019

![]()