Whites Writing Whiteness Google Analytics Data Report: 1 July – 31 December 2016
This draft report contains provisional information about WWW website use for the particular time-period it covers. It has been compiled in a fairly undigested form from Google Analytics data, and will be subject to in-depth comparative analysis at culmination of the WWW project.
Changes from Last Report
In comparing user and traffic data of the Whites Writing Whiteness website with the previously reported period (1 July 2016 – 31 December 2016), there are new developments to report. Firstly, a growing number of users continue to access the website from a still-wider range of places. The website was accessed from 482 cities in 89 countries (compared with 85 in the previously reported period). Secondly, the ‘How To’ area of the website has been very successful, with 288 pageviews since its launch in late April 2016. Thirdly, there has been a 71% increase in use of the ‘Thinking with Elias’ pages as well as a 53% increase in readership of the pages in the ‘Traces’ area of the website.
The Six Month Report
The WWW website was visited by 1,281 unique users between 1 July 2016 and 31 December 2016. The site was accessed 1,882 times, from 89 countries, with the top ten countries in terms of number of users being the UK, USA, South Africa, Poland, Australia, Canada, Germany, the Netherlands, Denmark and India, and with visits from other countries including France, Japan, Turkey, Finland, Russia, Sweden, Zimbabwe, Brazil, Spain and China.
The site continues to have users who repeatedly visit the site and many who spend much longer than average looking at its pages. Particularly prolific repeat users for this period access the site from South Africa, Poland, the Netherlands, Canada, Turkey, Brazil, Australia the USA and the UK, including some habitual users from London, Cape Town, Pietermaritzburg, Adelaide, Sydney, Frankfurt, New York, Pretoria and Helsinki. For more detailed information, please see Table 6.
Users view many pages per visit, with an average of 3 (2.65) pages viewed per visit. Overall, there have been 4,992 page views in total. There have been 618 habitual users, spending detailed time on average 4 (3.72) pages per visit, while the 1,264 new users view an average of 2 (2.13) pages.
Regarding how frequently users return to the site, there have been 2 visits to the site by 115 users, between 26 and 50 visits to the site by 52 users, between 101 and 200 visits to the site by 80 users, and more than 201 visits to the site by 262 users. These data indicate a serious research use by some 340+ in-depth users, with the corresponding most-used pages presenting verbatim transcribed letters and documents, and containing detailed analytical discussion. This demonstrates a major increase compared with the previous reported period. The average number users visiting the site per month is usually over 200 and sometimes over 250.
Concerning length of users’ sessions, 133 users have spent between 3 and 10 minutes browsing the website, 93 users have spent between 10.1-30 minutes, and 49 users spent more than 31 minutes.
| Breakdown of Site Usage by Month: 1 July 2016 – 31 December 2016 | ||||
| Users | Pageviews | Avg. visit duration (mins) | Freq. visitor countries | |
| July | 261 | 838 | 1.41 | 37 |
| August | 166 | 676 | 3.14 | 31 |
| September | 184 | 702 | 2.26 | 35 |
| October | 228 | 866 | 2.16 | 45 |
| November | 274 | 941 | 2.07 | 53 |
| December | 215 | 969 | 3.41 | 45 |
The most accessed page after the homepage for this period is the project ‘Blog’, with the ‘Reading lists’, ‘Traces Remaining’ and ‘How-to’ areas also highly popular. The project blog contains methodological and theoretical discussion in addition to project updates, and users continue to follow these discussions.
User Traffic
The majority of users (66.1%) find the website through organic searches via Google and other search engines. Many users also visit the website by direct link (17.2%) or via referrals from the Edinburgh University’s website (10%).
Where users access the site from, and how often:
Tables 1 through 5 below present geographical images show the frequency of website usage for this reported period. These indicate number of visits to the website by saturation of blue ranging from light blue (fewer sessions) to dark blue (the most sessions), and the range in the bottom left corner indicates the lower and upper bound of sessions for this period according to continent (Table 1), sub-continent (Table 2), and sub-regions (Tables 3-5).
Table 1. Number of Visits by Continent
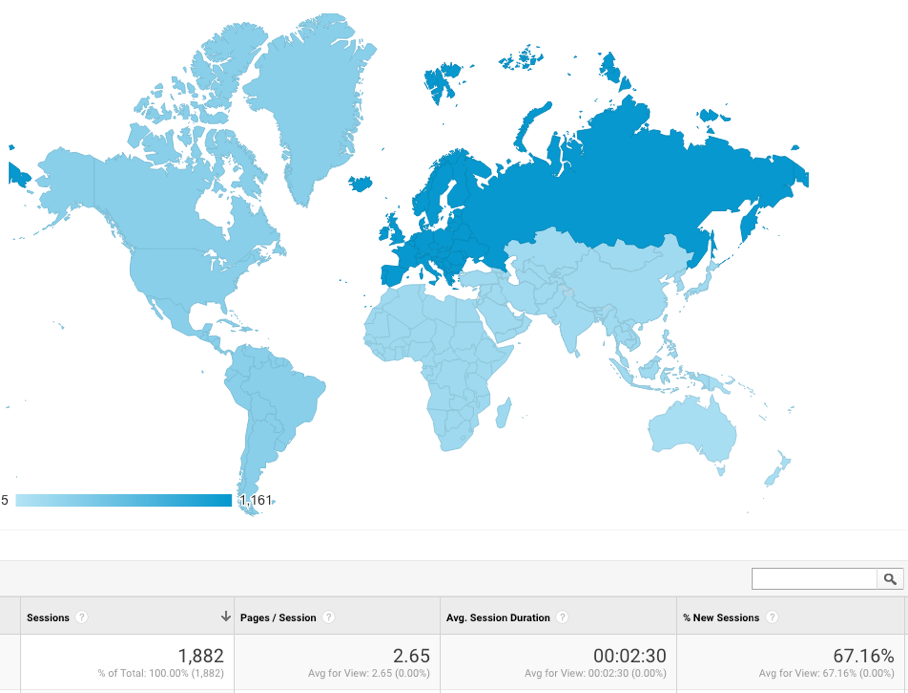
Above, the range spans from 5 sessions ((not set)***) to 1,161 sessions (Europe), and indicates via darkening shades of blue that the most users accessed the website from Europe for this reported period.
***(not set) indicates that location data could not be determined for the associated users. This could mean, for example, that IP addresses were masked or were not made available for data collection because of some other reason. 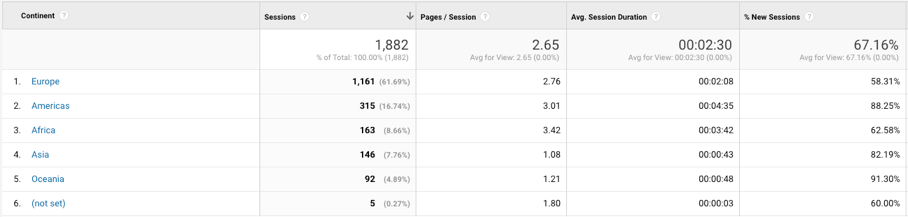
The data above demonstrate that the majority of Whites Writing Whiteness website users access the website from Europe (61.7%), the Americas (16.8%), and Africa (8.6%), and that users from the Americas and Africa tend to spend the most time on the website.
Table 2. Number of Visits by Sub-Continent Region
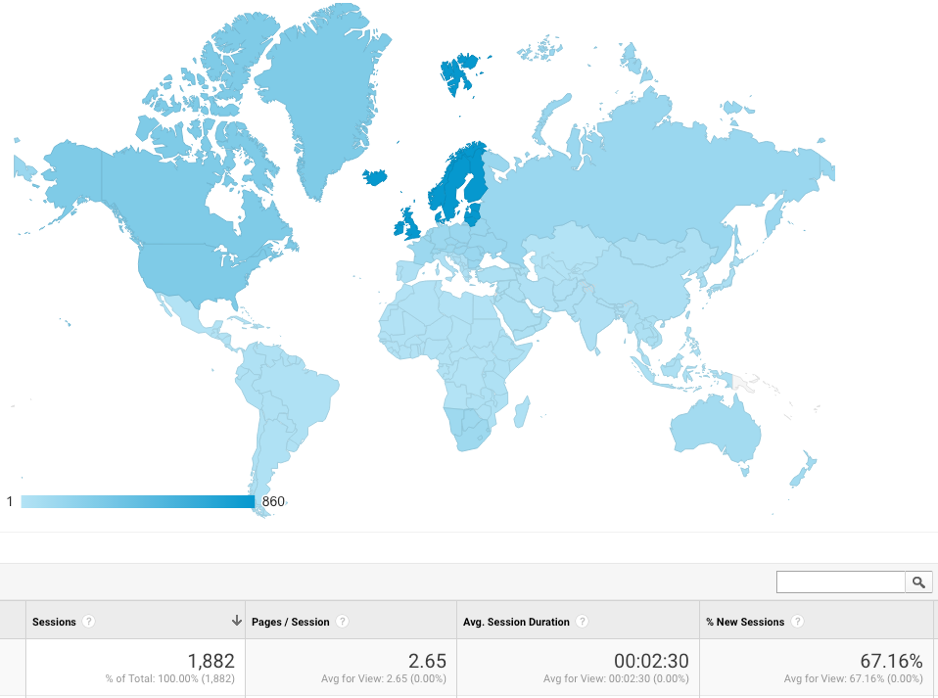
Above, the range spans from 1 session (Central Asia) to 860 sessions (Northern Europe), and indicates via darkening shades of blue that the most users accessed the website from Northern Europe for this reported period.
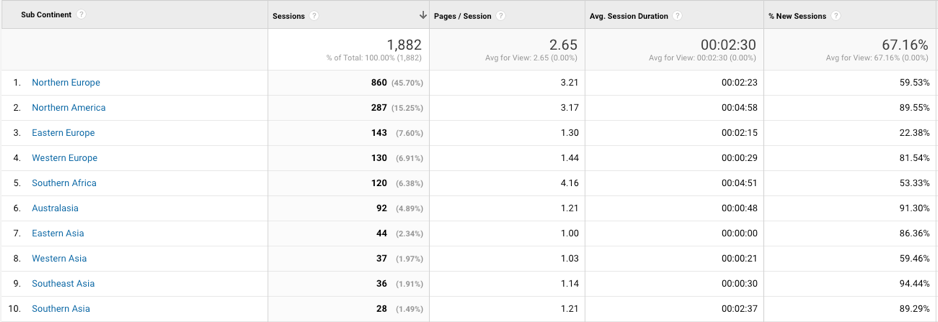
The data above demonstrate that the majority of Whites Writing Whiteness website users access the website from Northern Europe (45.7%), Northern America (15.3%) and Eastern Europe (7.6%), and that users from Northern America, Southern Africa and Southern Asia tend to spend the most time on the website.
Table 3. Number of Users by Sub-Region – South Africa
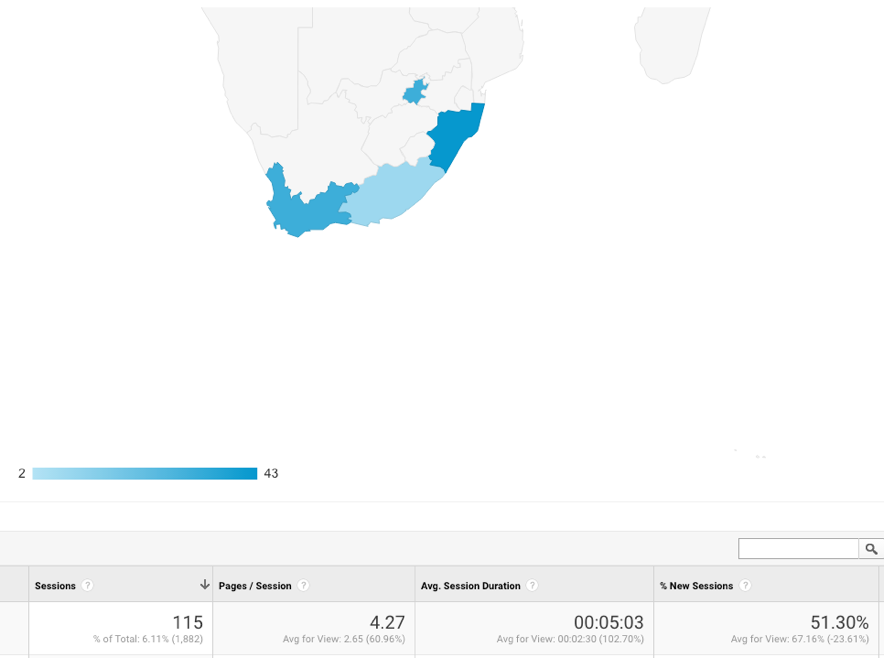
Above, the range spans from 2 sessions (Limpopo) to 43 sessions (KwaZulu-Natal), and indicates via darkening shades of blue that the most users accessed the website from KwaZulu-Natal for this reported period.
The data above demonstrate that the majority of Whites Writing Whiteness website users access the website from the KwaZulu-Natal (37.4%), Western Cape (26.9%), and Gauteng (26.9%) regions, and that users from KwaZulu-Natal and Western Cape regions tend to spend the most time on the website.
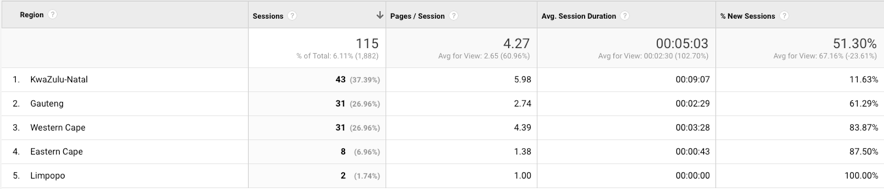
Table 4. Number of Users by Sub-Region – United States
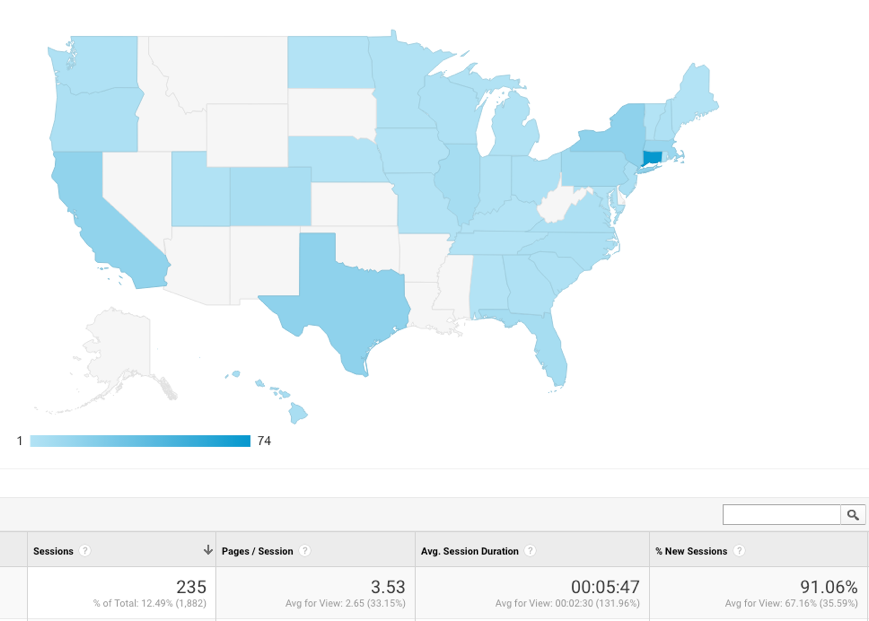 Above, the range spans from 1 session (Vermont) to 74 sessions (Connecticut), and indicates via darkening shades of blue that the most users accessed the website from Connecticut for this reported period.
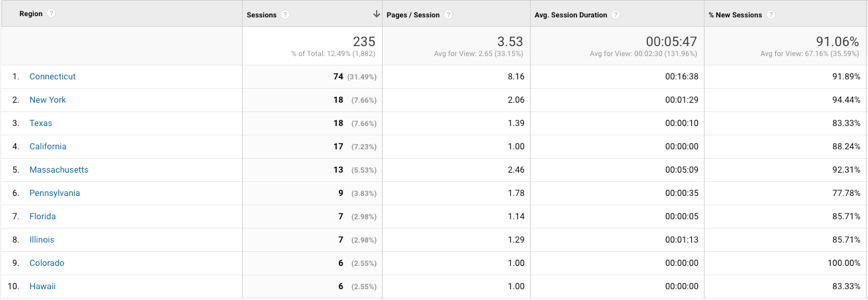 The data above demonstrate that the majority of Whites Writing Whiteness website users access the website from the states of Connecticut (31.5%), New York (7.7%), and Texas (7.7%), although users from Massachusetts and Wisconsin as well as Connecticut tend to spend the most time on the website.
Table 5. Number of Views by Sub-Region – UK
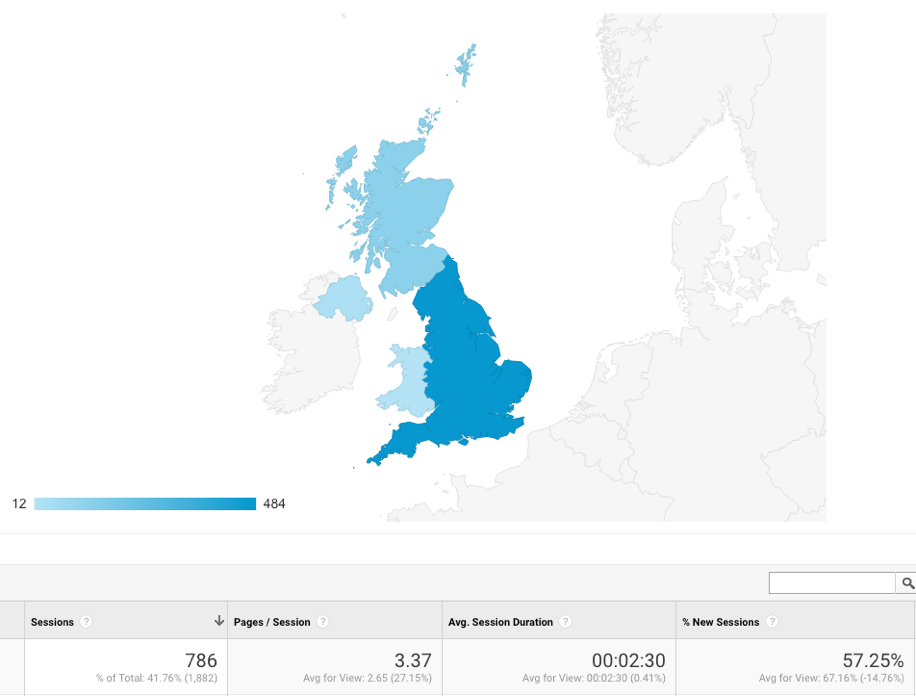 Above, the range spans from 12 sessions (Wales) to 484 sessions (England), and indicates via darkening shades of blue that the most users accessed the website from England for this reported period.
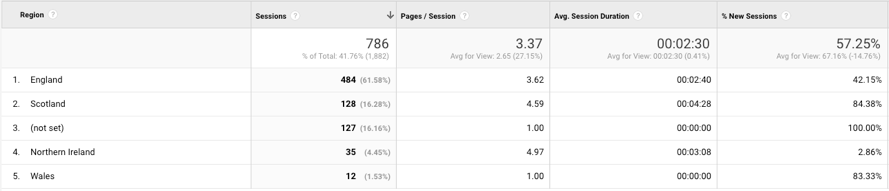
The data above demonstrate that the majority of Whites Writing Whiteness website users access the website from England (61.6%), Scotland (16.3%), and (not set) (16.2%), with users from Scotland and England tending to spend the most time on the website.
| Table 6: Cities, Number of Visits and Pages Accessed | ||||||
| The data below show, by city, the top numbers of visits, number of pages accessed on average and the average duration spent on the site, respectively. N.B. asterisks denote particularly intense site usage and/or high numbers of visits. | ||||||
| Country | City | Visits | Pages accessed | Avg. visit duration (mins) | ||
| UK
(10 of 100)
|
(not set) | 152* | 1.28 | 00:20 | ||
| London | 120* | 2.92 | 01:59 | |||
| Edinburgh | 98* | 5.37* | 05:02* | |||
| Liverpool | 92* | 5.33* | 04:17* | |||
| Bolton | 89* | 5.13* | 03:22 | |||
| Londonderry | 17* | 4.76* | 03:56* | |||
| Blackburn | 16* | 6.38* | 08:13* | |||
| Sheffield | 12 | 1.42 | 00:07 | |||
| Cambridge | 10 | 6.50* | 02:18 | |||
| Leeds | 8 | 1.25 | 00:01 | |||
| USA
(10 of 100)
|
Woodbury | 37* | 8.76* | 21:14* | ||
| Monroe | 36* | 7.75* | 12:22* | |||
| New York | 13* | 2.23* | 01:48 | |||
| Los Angeles | 6 | 1.00 | 00:00 | |||
| Denton | 6 | 2.00 | 00:25 | |||
| Berkeley | 5 | 1.00 | 00:00 | |||
| Chicago | 5 | 1.20 | 01:31 | |||
| Cambridge | 5 | 3.60* | 011:52* | |||
| (not set) | 4 | 1.00 | 00:00 | |||
| Tallahassee | 4 | 1.25 | 00:09 | |||
| Australia
(10 of 11)
|
Adelaide | 32* | 1.25* | 01:34 | ||
| Sydney | 19* | 1.16 | 00:08 | |||
| Brisbane | 11* | 1.00 | 00:00 | |||
| Melbourne | 8* | 1.25* | 00:09 | |||
| Canberra | 6 | 1.17 | 00:05 | |||
| Perth | 5 | 1.00 | 00:00 | |||
| Armidale | 1 | 1.00 | 00:00 | |||
| Cairns | 1 | 2.00* | 00:17 | |||
| Townsville | 1 | 2.00* | 10:27* | |||
| Central Coast | 1 | 1.00 | 00:00 | |||
| South Africa
(10 of 18)
|
Cape Town | 29* | 4.62* | 03:42* | ||
| Pietermaritzburg | 21* | 6.62* | 09:41* | |||
| Pretoria | 14* | 2.64 | 00:59 | |||
| Chatsworth | 12* | 3.58* | 06:31* | |||
| Johannesburg | 8* | 1.12 | 01:29 | |||
| Durban | 8 | 9.12* | 13:47* | |||
| Grahamstown | 3 | 1.67 | 00:14 | |||
| Port Elizabeth | 3 | 1.33 | 01:41 | |||
| Kempton Park | 3 | 8.00* | 10:06 | |||
| Sandton | 3 | 2.00 | 01:16 | |||
Last updated: 15 March 2017

![]()