Whites Writing Whiteness Google Analytics Data Report
1 January 2014 – 30 June 2014
This draft report contains provisional information about WWW website use for the particular time-period it covers. It has been compiled in a fairly undigested form from Google Analytics data, and will be subject to in-depth comparative analysis at culmination of the WWW project.
Changes from Last Report
In comparing user and traffic data of the Whites Writing Whiteness website with the previously reported period (1 July 2013 – 31 December 2013), several developments are apparent. Firstly, the number of users visited the website has increased 44.8% (from 578 to 837 users). Secondly, the reach of the website’s user-base has increased, with users now accessing the website from 70 countries (56 in previous period) and from 341 cities around the world (230 in the previous report). Lastly, both the number of pages viewed and the average duration of website visitation have increased (by 178.8% and 75.2% respectively) with users now viewing 4,160 pages (compared with 1,492) and users actively using the website for 2:40 minutes (compared with 1:30 minutes) per session.
The Six Month Report
The WWW website was visited by 837 unique users between 1 January 2014 and 30 June 2014. The site was accessed 1,425 times, from 70 countries, with the top ten countries in terms of number of users being the UK, South Africa, USA, Australia, France, Canada, the Netherlands, Germany, Tanzania, and Ireland respectively, and with visits from other countries including Brazil, Italy, Kenya, Thailand, Nigeria, Zimbabwe, Portugal, Greece, Belgium and Indonesia.
The site continues to have users who repeatedly visit the site and many who spend much longer than average looking at its pages. Particularly prolific repeat users access the site are from South Africa, Australia, France, Canada, the Netherlands, the USA and the UK, including some habitual users from London, Johannesburg, Cape Town, Toronto, Amsterdam, Dublin, New York, Chicago and Los Angeles. For more detailed information, please see Table 6.
Users view many pages per visit, with an average of 3 (2.92) pages viewed each visit. Overall, there have been 4,160 page views in total. There have been 612 habitual users, spending detailed time on average 5 (4.9) pages per visit, while the 813 new users view an average of 2 (1.75) pages.
Regarding how frequently users return to the site over this period, there have been 2 visits to the site by 93 users, between 26 and 50 visits by 135 users, and between 101 and 200 visits to the site by 54 users. These data indicate a serious research use by some 180 in-depth users, with the corresponding most-used pages containing detailed analytical discussion. The average number of users visiting the site per month is usually over 100 and sometimes over 160.
Concerning the length of user sessions, 95 users have spent between 3 and 10 minutes browsing the website, 72 users have spent between 10.1-30 minutes, and 31 users spent more than 31 minutes.
| Breakdown of Site Usage by Month: 1 January 2013 – 30 June 2013 | ||||
| Users | Pageviews | Avg. visit duration (mins) | Freq. visitor countries | |
| January | 94 | 1,696 | 02:42 | 24 |
| February | 144 | 1,281 | 04:46 | 32 |
| March | 161 | 1,584 | 02:02 | 37 |
| April | 153 | 1,444 | 02:51 | 29 |
| May | 183 | 1,474 | 01:26 | 23 |
| June | 161 | 846 | 02:24 | 23 |
The most accessed page after the homepage for this period is the project ‘Blog’, with the ‘Latest Project News’, ‘Minerals Revolution’ and the ‘Research Methodologies’ areas also highly popular. The project blog contains methodological and theoretical discussion in addition to project updates, and users continue to follow these discussions.
User Traffic
The majority of users (56.7%) find the website through organic searches via Google and other search engines. Many users also visit the website by direct link (32.6%) or via referrals from the Edinburgh University’s website (3.1%).
Where users access the site from, and how often:
Tables 1 through 5 below present geographical images show the frequency of website usage for this reported period. These indicate number of visits to the website by saturation of blue ranging from light blue (fewer sessions) to dark blue (the most sessions), and the range in the bottom left corner indicates the lower and upper bound of sessions for this period according to Continent (Table 1), Sub-continent (Table 2), and sub-regions (Tables 3-5).
Table 1. Number of Visits by Continent 
Above, the range spans from 2 sessions ((not set)***) to 870 sessions (Europe), and indicates via darkening shades of blue that the most users accessed the website from Europe for this reported period.
***(not set) indicates that location data could not be determined for the associated users. This could mean, for example, that IP addresses were masked or were not made available for data collection because of some other reason.
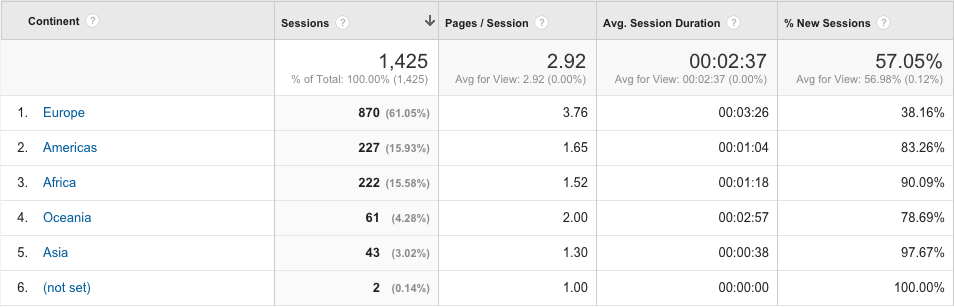
The data above demonstrate that the majority of Whites Writing Whiteness website users access the website from Europe (61.1%), the Americas (15.9%), and Africa (15.6%), and that users from Europe and Oceania tend to spend the most time on the website.
Table 2. Number of Visits by Sub-Continent Region
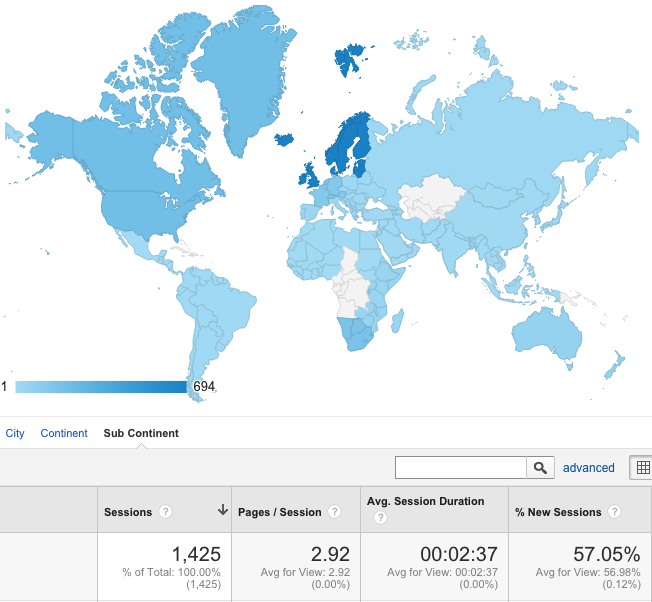 Above, the range spans from 1 session (Micronesian Region) to 694 sessions (Northern Europe), and indicates via darkening shades of blue that the most users accessed the website from Northern Europe for this reported period.

The data above demonstrate that the majority of Whites Writing Whiteness website users access the website from Northern Europe (48.7%), Northern America (14.9%) and Southern Africa (11.8%), and that users from Northern Europe and Australia, as well as the Western and Southern regions of Africa tend to spend the most time on the website.
Table 3. Number of Visits by Sub-Region – South Africa 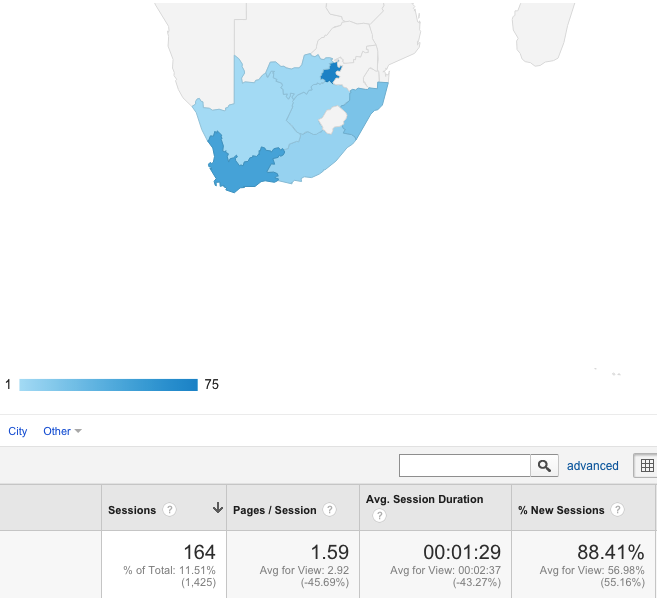
Above, the range spans from 1 session (Northern Cape) to 75 sessions (Gauteng), and indicates via darkening shades of blue that the most users accessed the website from Gauteng for this reported period.
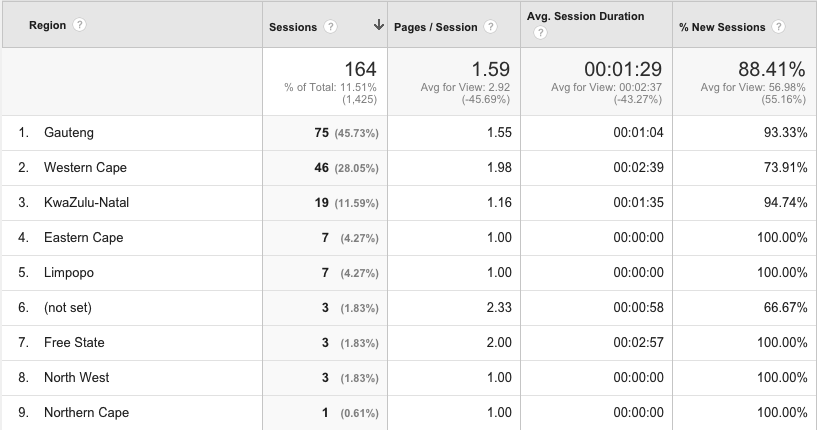
The data above demonstrate that the majority of Whites Writing Whiteness website users access the website from the Gauteng (45.7%), Western Cape (28.1%), and KwaZulu-Natal (11.6%) regions, and that users from the Free State and Western Cape regions tend to spend the most time on the website.
Table 4. Number of Users by Sub-Region – United States
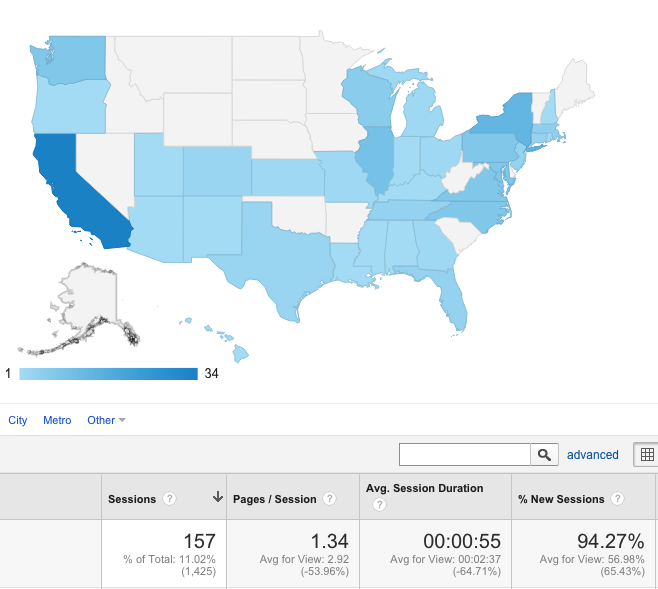
Above, the range spans from 1 session (Utah) to 34 sessions (California), and indicates via darkening shades of blue that the most users accessed the website from California for this reported period. 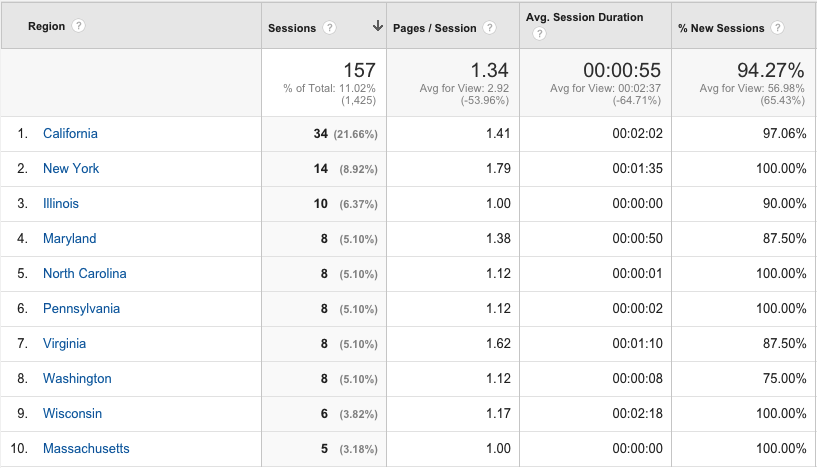
The data above demonstrate that the majority of Whites Writing Whiteness website users access the website from the states of California (21.7%), New York (8.9%), and Illinois (6.4%), though users from the Kansas and Wisconsin tend to spend the most time on the website.
Table 5. Number of Views by Sub-Region – UK
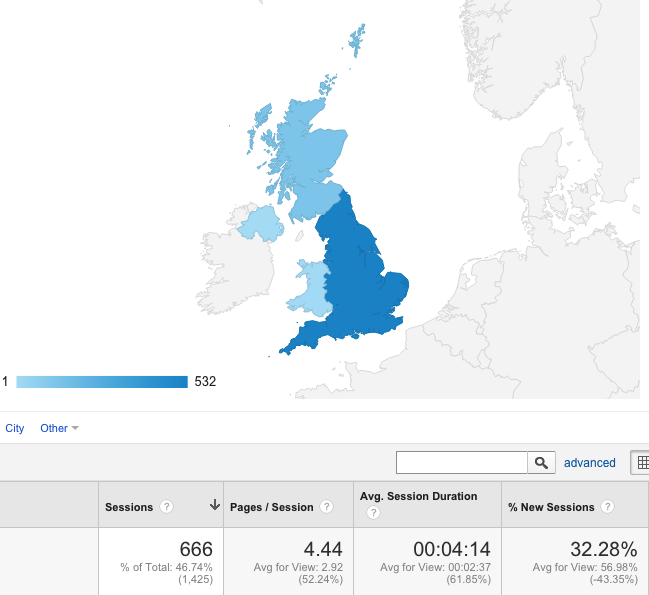 Above, the range spans from 1 session (Northern Ireland) to 532 sessions (England), and indicates via darkening shades of blue that the most users accessed the website from England for this reported period.
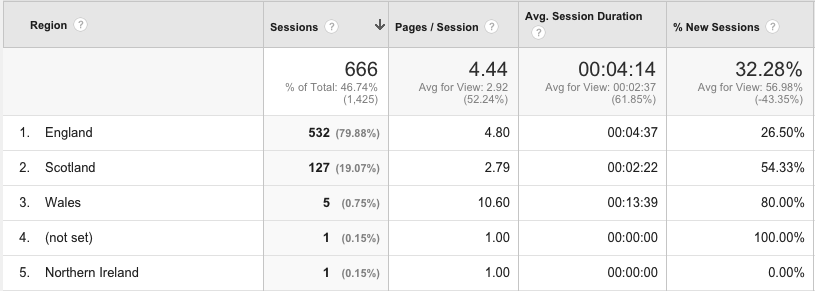
The data above demonstrate that the majority of Whites Writing Whiteness website users access the website from England (79.9%), Scotland (19.1%), and Wales (0.8%), and that users from the Wales and England tend to spend the most time on the website.
| Table 6: Cities, Number of Visits and Pages Accessed | ||||||
| The data below show, by city, the number of visits, number of pages accessed on average and the average duration spent on the site, respectively. N.B. asterisks denote particularly intense site usage and/or high numbers of visits. | ||||||
| Country | City | Visits | Pages accessed | Avg. visit duration (mins) | ||
| UK
(10 of 67) |
Edinburgh | 111* | 2.78 | 02:37 | ||
| Cambridge | 106* | 15.43* | 16:40* | |||
| Brighton | 89* | 1.10 | 00:12 | |||
| London | 63* | 1.63 | 00:56 | |||
| Lytham Saint Annes | 27* | 3.33 | 04:57* | |||
| Leeds | 26* | 1.38 | 00:53 | |||
| Oxford | 19* | 2.00 | 01:12 | |||
| Lancaster | 15 | 5.40* | 10:04* | |||
| Morecambe | 15 | 3.40 | 04:23 | |||
| Burgess Hill | 11 | 1.82 | 02:01 | |||
| USA
(10 of 104) |
Isla Vista | 8* | 1.25 | 03:36* | ||
| Los Angeles | 7* | 1.14 | 00:30 | |||
| Chicago | 7* | 1.00 | 00:00 | |||
| New York | 7* | 1.14 | 01:55* | |||
| (not set) | 4 | 2.00* | 00:20 | |||
| Santa Barbara | 4 | 1.00 | 00:00 | |||
| Philadelphia | 4 | 1.00 | 00:00 | |||
| Seattle | 4 | 1.00 | 00:00 | |||
| Milwaukee | 4 | 1.00 | 00:00 | |||
| Fairfax | 3 | 1.00 | 00:00 | |||
| Australia
(9 of 9) |
Melbourne | 18* | 2.89* | 02:47 | ||
| Mudgee | 10* | 1.70 | 04:13* | |||
| Sydney | 8 | 1.50 | 05:13* | |||
| Brisbane | 7 | 1.71 | 00:52 | |||
| Perth | 6 | 1.50 | 02:39 | |||
| Adelaide | 4 | 2.25 | 04:57* | |||
| Cairns | 2 | 1.00 | 00:00 | |||
| Geelong | 2 | 1.00 | 00:00 | |||
| Sunshine Coast | 1 | 3.00* | 03:44* | |||
| South Africa
(10 of 24) |
Johannesburg | 49* | 1.59 | 01:24 | ||
| Cape Town | 44* | 2.02* | 02:46* | |||
| Pretoria | 8 | 1.12 | 00:09 | |||
| Durban | 7 | 1.00 | 00:00 | |||
| Grahamstown | 7 | 1.43 | 04:19* | |||
| Thohoyandou | 5 | 1.00 | 00:00 | |||
| East Kibdib | 4 | 1.00 | 00:00 | |||
| Sandton | 4 | 2.00* | 00:44 | |||
| Vanderbijlpark | 4 | 1.25 | 00:53 | |||
| (not set) | 3 | 2.33* | 00:58 | |||
Last updated: 31 January 2016

![]()