Whites Writing Whiteness Google Analytics Data Report: 1 January – 30 June 2017
This report contains provisional information about WWW website use for the particular time-period it covers. It has been compiled from Google Analytics data, and will be subject to in-depth comparative analysis at a later stage.
Changes from the Last Report
In comparing user and traffic data from the Whites Writing Whiteness website with the previously reported period (1 July 2016 – 31 December 2016), several pleasing developments are apparent. Firstly, the number of visits to the website has risen 56.9% (from 1,882 to 2,953 respectively), with the new users also rising by 48.3%. Secondly, the number of visitors has increased by 48.5% (from 1,281 to 1,902 users) — with these users based in 101 countries and 714 cities around the world (versus 482 cities in 89 countries for the previous period). Thirdly, the number of pages viewed has also risen by 60.8%, with users collectively having viewed 8,031 pages (versus 4,992) during their visits to the website. The fact that website use continues to rise is extremely pleasing, and analysis of the details of usage indicates that this is a result of the regular posting of research-rich material and of the research tools on this.
The Six Month Report
The WWW website was visited by 1,902 unique users between 1 January 2017 and 30 June 2017. The site was accessed 2,953 times, from 101 countries, with the top ten countries in terms of number of users being the UK, USA, South Africa, Australia, Germany, Canada, India, Denmark, the Netherlands, and Bulgaria respectively, and with visits from other countries including Ireland, Finland, Sweden, Spain, New Zealand, Italy, France, Zimbabwe, Hong Kong and Kenya.
The site continues to have users who repeatedly visit the site and many who spend much longer than average looking at its pages. Particularly prolific repeat users access the site from South Africa, the UK, US, and the Australia, including some habitual users from London, Edinburgh, Cape Town, Cardiff, New York, Sofia and Sydney. For more detailed information, please see Table 6.
Users view many pages per visit, with an average of 3 (2.72) pages viewed each visit. Overall, there have been 8,031 page views in total. There have been 279 habitual users, spending detailed time on average 4 (4.33) pages per visit, while the 1,875 new users view an average of 2 (1.79) pages.
Regarding how frequently users return to the site, there have been 2 visits to the site by 269 users, between 25 and 50 visits to the site by 75 users, between 101 and 200 visits to the site by 138 users, and more than 200 visits to the site by 135 users. These data indicate a serious research use by some 200+ in-depth users, with the corresponding most-used pages presenting verbatim transcribed letters and documents, and containing detailed analytical discussion. It is very pleasing that users are responding so positively to the most research-rich aspects of the website pages.
Concerning length of users’ sessions, 198 users have spent between 3 and 10 minutes browsing the website, 158 users have spent between 10.1-30 minutes, and 58 users spent more than 31 minutes. The average number of users visiting the site per month is usually over 270 and sometimes over 400.
| Breakdown of Site Usage by Month: 1 January 2017 – 30 June 2017 | ||||
| Users | Pageviews | Avg. visit duration (mins) | Freq. visitor countries | |
| January | 273 | 1,035 | 3:15 | 47 |
| February | 366 | 1,656 | 3:00 | 52 |
| March | 361 | 1,108 | 1:34 | 55 |
| April | 402 | 2,109 | 2:55 | 61 |
| May | 299 | 1,066 | 2:59 | 45 |
| June | 280 | 1,057 | 1:42 | 53 |
The most accessed page after the homepage is the project ‘Blog’, with the ‘Reading Lists’, ‘Collections’ (providing detailed information about collections worked with) and the ‘Podcasts’ (a number of recorded presentations from conferences associated with the project) areas also being highly popular. The project blog contains largely theoretical discussions in addition to project updates, and many users continue to follow these discussions.
There are a number of facilities which have been designed to support research use, and it is very pleasing that these are as effective as they are. The Traces area of the website, introduced in an earlier report (Jul-Dec 2015: 2), continues to be widely read and used by readers. In addition, launched in March 2016, ‘How to…’ is an increasingly popular area of the WWW website. Devoted to ‘how’ topics for doing high quality archival research, ‘How to…’ was introduced as an innovation aiming to support the research use of the material on the WWW pages and also to encourage secondary analysis, and is one which seems to have proved useful to WWW readers. The range of ‘How to…’ topics is expanding, and at present there are ten detailed posts on matters including methods of mapping collections, document interpretation, and beginning and finishing an archival research project.
In addition to tracking use of the WWW pages via Google Analytics, email contacts and traffic arising from more one-off enquiries are also logged. In this current period, over 20 such enquiries have been fielded. These are a combination of family history enquiries, requests for expert advice or opinion, and the provision of information about secondary analysis/use.
User Traffic
The majority of users (70%) find the website through organic searches via Google and other search engines. Many users also visit the website by direct link (19.1%) or via referrals from the Edinburgh University’s website (14.7%).
Where users access the site from, and how often:
Tables 1 through 5 below present geographical images show the frequency of website usage for this reported period. These indicate number of visits to the website by saturation of blue ranging from light blue (fewer sessions) to dark blue (the most sessions), and the range in the bottom left corner indicates the lower and upper bound of sessions for this period according to continent (Table 1), sub-continent (Table 2), and sub-regions (Tables 3-5).
Table 1. Number of Visits by Continent
Above, the range spans from 2 sessions ((not set)***) to 1,747 sessions (Europe), and indicates via darkening shades of blue that the most users accessed the website from Europe for this reported period.

***(not set) indicates that location data could not be determined for the associated users. This could mean, for example, that IP addresses were masked or were not made available for data collection because of some other reason.
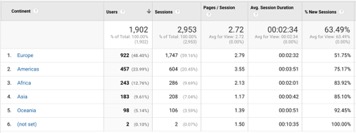
The data above demonstrate that the majority of Whites Writing Whiteness website users access the website from Europe (48.4%), the Americas (24%), and Africa (12.7%), and that users from Europe and the Americas tend to spend the most time on the website.
Table 2. Number of Visits by Sub-Continent Region 
Above, the range spans from 2 sessions (not set) to 1,414 sessions (Northern Europe), and indicates via darkening shades of blue that the most users accessed the website from Northern Europe for this reported period. 
The data above demonstrate that the majority of Whites Writing Whiteness website users access the website from Northern Europe (33.7%), Northern America (21.8%) and Southern Africa (8.1%), and that users from ((not set): 10:36 mins, not pictured) and Northern America tend to spend the most time on the website.
Table 3. Number of Users by Sub-Region – South Africa
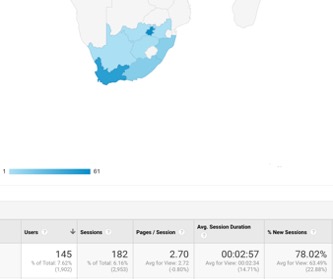 Above, the range spans from 1 session (the North West) to 68 sessions (Western Cape), and indicates via darkening shades of blue that the most users accessed the website from the Western Cape for this reported period.
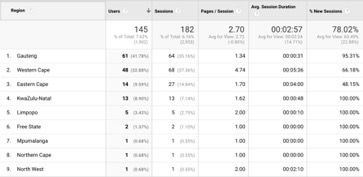
The data above demonstrate that the majority of Whites Writing Whiteness website users access the website from Gauteng (41.8%), the Western Cape (32.9%), and the Eastern Cape (9.6%) regions, and that users from the Western Cape and the Eastern Cape regions tend to spend the most time on the website.
Table 4. Number of Users by Sub-Region – United States

Above, the range spans from 1 session (Alabama) to 155 sessions (Connecticut), and indicates via darkening shades of blue that the most users accessed the website from Connecticut for this reported period.

The data above demonstrate that the majority of Whites Writing Whiteness website users access the website from the states of Connecticut (21.9%), California (14.5%), and New York (10.4%), and users from Connecticut and the Washington DC [not pictured: 5:44 mins] tend to spend the most time on the website.
Table 5. Number of Views by Sub-Region – UK

Above, the range spans from 50 session (Northern Ireland) to 923 sessions (England), and indicates via darkening shades of blue that the most users accessed the website from England for this reported period.
The data above demonstrate that the majority of Whites Writing Whiteness website users access the website from England (69.7%), Scotland (20.8%) and Wales (7%), and that users from England and Northern Ireland tend to spend the most time on the website.
| Table 6: Cities, Number of Visits and Pages Accessed | ||||
| The data below show, by city, the number of visits, number of pages accessed on average and the average duration spent on the site, respectively. N.B. asterisks denote particularly intense site usage and/or high numbers of visits. | ||||
| Country | City | Visits | Pages accessed | Avg. visit duration (mins) |
| UK
(10 of 142) |
Liverpool | 199* | 4.33* | 05:25* |
| Edinburgh | 189* | 2.61 | 02:46 | |
| London | 168* | 1.99 | 02:11 | |
| Morecambe | 110* | 5.05* | 05:18* | |
| (not set) | 42* | 3.17 | 02:07 | |
| Bolton | 38* | 5.26* | 06:07* | |
| Cardiff | 37* | 1.30 | 00:54 | |
| Blackpool | 27* | 7.85* | 06:29* | |
| Cambridge | 25* | 2.36 | 01:24 | |
| Sheffield | 22 | 1.59 | 01:00 | |
| USA
(10 of 183) |
Woodbury | 91* | 7.85* | 13:30* |
| Monroe | 56* | 11.11* | 11:06* | |
| New York | 42* | 4.86* | 02:50 | |
| Los Angeles | 20* | 1.60 | 00:07 | |
| Boston | 7 | 1.00 | 00:00 | |
| Seattle | 6 | 1.00 | 00:08 | |
| Washington DC | 5 | 4.40* | 05:44* | |
| Chicago | 5 | 1.20 | 00:47 | |
| Butner | 5 | 1.20 | 02:47 | |
| Portland | 5 | 2.00 | 00:19 | |
| Australia
(10 of 13) |
Sydney | 23* | 1.57* | 01:29 |
| Melbourne | 15* | 1.93* | 02:34* | |
| Adelaide | 12* | 1.08 | 00:18 | |
| Perth | 12* | 1.00 | 00:00 | |
| Brisbane | 11 | 1.36 | 00:07 | |
| Canberra | 3 | 1.33 | 00:04 | |
| Kiana | 1 | 1.00 | 00:00 | |
| Wollongong | 1 | 1.00 | 00:00 | |
| Alice Springs | 1 | 1.00 | 00:00 | |
| Darwin | 1 | 1.00 | 00:00 | |
| South Africa
(10 of 25) |
Cape Town | 67* | 4.79* | 05:41* |
| Johannesburg | 18* | 1.39 | 00:32 | |
| Sandton | 18* | 1.28 | 00:58 | |
| Pretoria | 15* | 1.27 | 00:16 | |
| Grahamstown | 14* | 2.14* | 05:16* | |
| Port Elizabeth | 9 | 1.22 | 03:13* | |
| Durban | 7 | 1.14 | 00:40 | |
| Centurion | 5 | 1.00 | 00:00 | |
| East London | 4 | 1.25 | 01:23 | |
| Westville | 4 | 1.00 | 00:00 | |
Last updated: 4 June 2018

![]()