Whites Writing Whiteness Google Analytics Data Report
1 July 2013 – 31 December 2013
This draft report contains provisional information about WWW website use for the particular time-period it covers. It has been compiled in a fairly undigested form from Google Analytics data, and will be subject to in-depth comparative analysis at culmination of the WWW project.
Changes from Last Report
In comparing user and traffic data on the Whites Writing Whiteness website with the previously reported period (1 Jan 2013 – 30 June 2013), several developments are apparent. Firstly, the rate of first-time visits to the website has risen 19.4%, and the rate of overall user traffic has increased 10.9%, indicating continued increasing interest from a widening user-base. The number of consistent users has risen 24.2%, and new users have increased by 8.7%. Secondly, with regard to international usage, site traffic has increased for the rate of first-time visits having increased from users based in the USA (10.7%), Australia (73%) Canada (152.8%), the Netherlands (520.7%), Zimbabwe (228.6%) and Italy (20.5%). Thirdly, the ways in which users access the website has remained relatively stable, but with more users accessing the website via direct link (38.7%), and via google search (46%).
The Six Month Report
The WWW website was visited by 578 unique users between 1 July 2013 and 31 December 2013. The site was accessed 776 times, from 56 countries, with the top ten countries in terms of number of users being the UK, USA, South Africa, Australia, Canada, the Netherlands, Zimbabwe, India, Italy [and (not set)***], and with visits from other countries including Greece, Germany, Zambia, South Korea, Pakistan, Japan, Brazil and Finland.
***(not set) indicates that location data could not be determined for the associated users. This could mean, for example, that IP addresses were masked or were not made available for data collection because of some other reason.
The site has users who repeatedly visit and many who spend much longer than average looking at its pages. Particularly prolific repeat users access the site from South Africa, the Netherlands, Zimbabwe, Canada, Germany, India, Australia the USA and the UK, including some habitual users from London, Cape Town, Johannesburg, Melbourne, Amsterdam, Athens and New York. For more detailed information, please see Table 6.
Users continue to view many pages per visit, with an average of 2 (1.92) pages viewed per visit. Overall, there have been 1,492 page views in total. There have been 217 habitual users, spending detailed time on average 3 (2.58) pages per visit, while the 559 new users view an average of 2 (1.67) pages.
Regarding how frequently users return to the site, there have been, for example, 2 visits to the site by 69 users, between 26 and 50 visits to the site by 12 users, and between 51 and 100 visits to the site by 10 users. These data indicate a focused research use by 30+ in-depth users, with the corresponding most-used pages containing detailed analytical discussion. The average number of users visiting the site per month is usually over 50 and sometimes over 200.
Concerning length of users’ sessions, 39 users have spent between 3 and 10 minutes browsing the website, 23 users have spent between 10.1-30 minutes, and 8 users spent more than 31 minutes.
| Breakdown of Site Usage by Month: 1 July 2013 – 31 December 2013 | ||||
| Users | Pageviews | Avg. visit duration (mins) | Freq. visitor countries | |
| July | 55 | 117 | 01:15 | 17 |
| August | 53 | 144 | 02:11 | 14 |
| September | 111 | 283 | 01:45 | 24 |
| October | 233 | 555 | 01:51 | 27 |
| November | 107 | 257 | 00:53 | 26 |
| December | 63 | 136 | 00:45 | 23 |
The most accessed page after the homepage is the ‘Rhodes: Man, Myth and Matrix – Annotated Reading List’, with the project ‘Blog’, ‘Meet the Team’, and the ‘Diamonds & Gold’ areas also highly popular. The project blog in particular contains methodological and theoretical discussion in addition to project updates, and users continue to follow these discussions.
User Traffic
The majority of users (46%) find the website through organic searches via Google and other search engines. Many users also visit the website by direct link (38.7%) or via referrals from the Edinburgh University’s website (3.7%).
Where users access the site from, and how often:
Tables 1 through 5 below present geographical images show the frequency of website usage for this reported period. These indicate number of visits to the website by saturation of blue ranging from light blue (fewer sessions) to dark blue (the most sessions), and the range in the bottom left corner indicates the lower and upper bound of sessions for this period according to continent (Table 1), sub-continent (Table 2), and sub-regions (Tables 3-5).
Table 1. Number of Visits by Continent 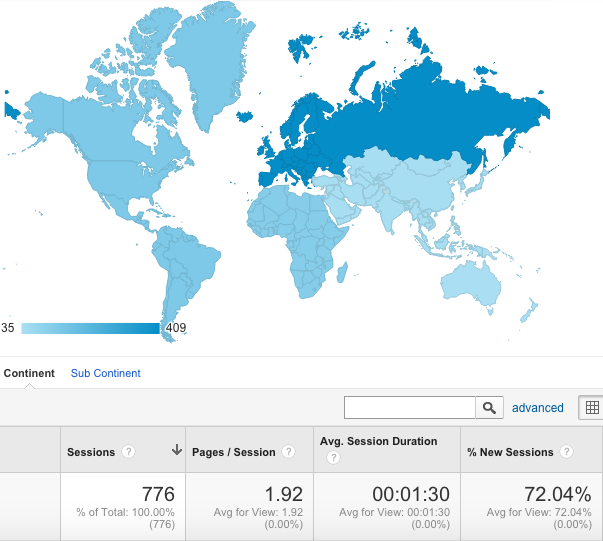
Above, the range spans from 35 sessions (Oceania) to 409 sessions (Europe), and indicates via darkening shades of blue that the most users accessed the website from Europe for this reported period.
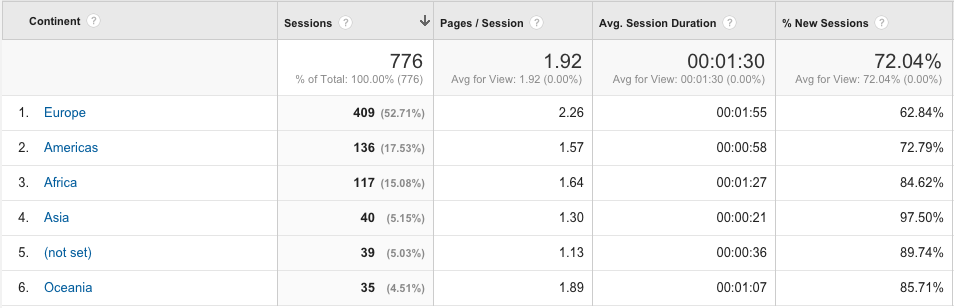 The data above demonstrate that the majority of Whites Writing Whiteness website users access the website from Europe (52.7%), the Americas (17.5%), and Africa (15.1%), and that users from Europe and Africa tend to spend the most time on the website.
Table 2. Number of Visits by Sub-Continent Region
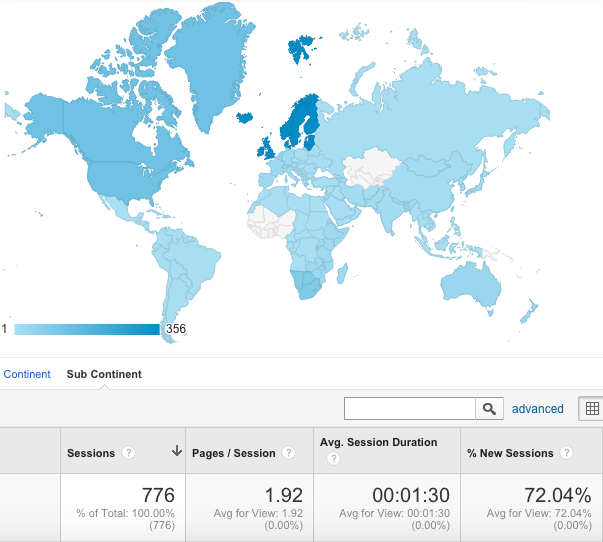
Above, the range spans from 1 session (Central America) to 356 sessions (Northern Europe), and indicates via darkening shades of blue that the most users accessed the website from Northern Europe for this reported period.
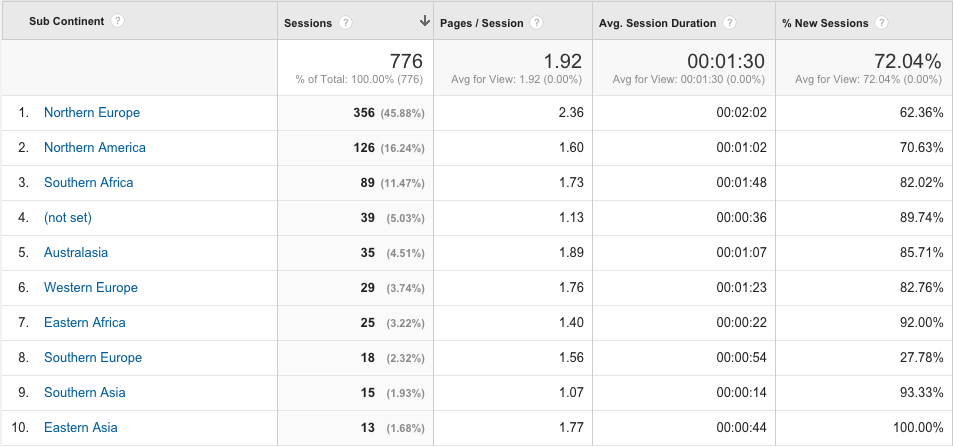 The data above demonstrate that the majority of Whites Writing Whiteness website users access the website from Northern Europe (45.9%), Northern America (16.2%) and Southern Africa (11.5%), and that users from Northern Europe and Southern Africa tend to spend the most time on the website.
Table 3. Number of Visits by Sub-Region – South Africa
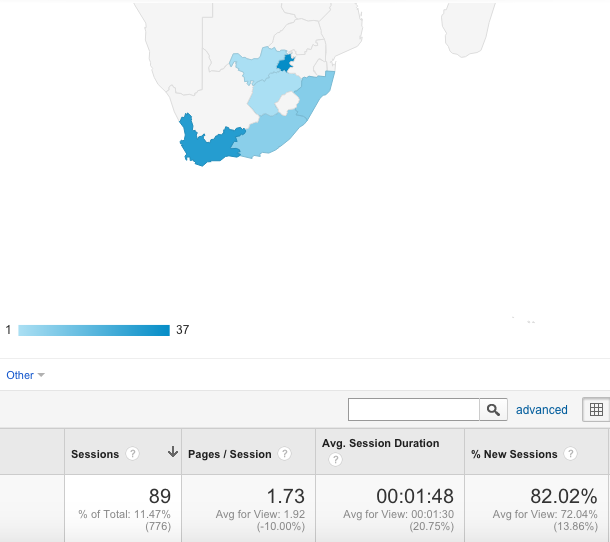 Above, the range spans from 1 session (the North West) to 37 sessions (Gauteng), and indicates via darkening shades of blue that the most users accessed the website from Gauteng for this reported period.

The data above demonstrate that the majority of Whites Writing Whiteness website users access the website from the Gauteng (41.6%), Western Cape (33.7%), and KwaZulu-Natal (10.1%) regions, and that users from the Gauteng and Western Cape regions also tend to spend the most time on the website.
Table 4. Number of Visits by Sub-Region – United States 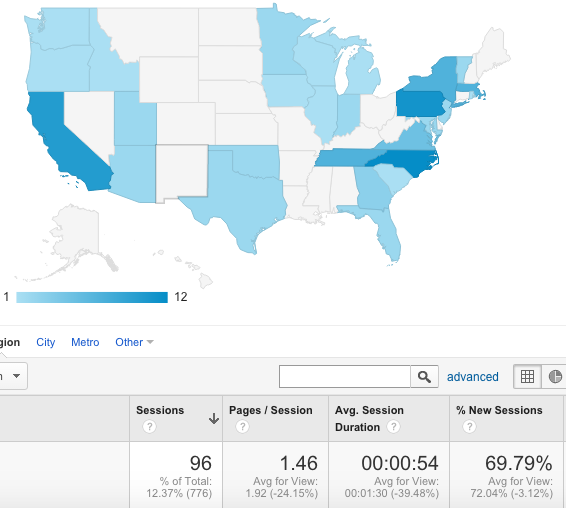
Above, the range spans from 1 session (District of Columbia) to 12 sessions (North Carolina), and indicates via darkening shades of blue that the most users accessed the website from North Carolina for this reported period. 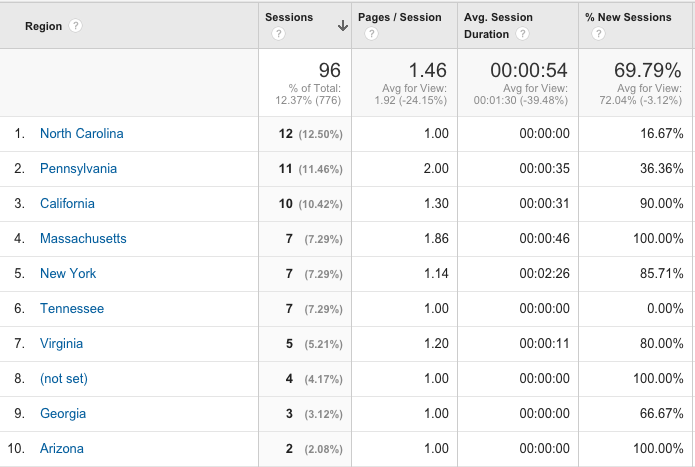
The data above demonstrate that the majority of Whites Writing Whiteness website users access the website from the states of North Carolina (12.5%), Pennsylvania (11.5%), and California (10.4%), though users from the Oklahoma and Michigan tend to spend the most time on the website.
Table 5. Number of Visits by Sub-Region – UK
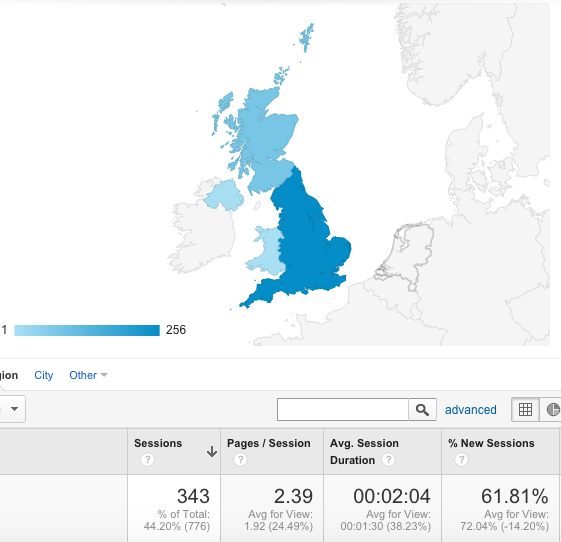 Above, the range spans from 1 session ((not set)) to 256 sessions (England), and indicates via darkening shades of blue that the most users accessed the website from England for this reported period.
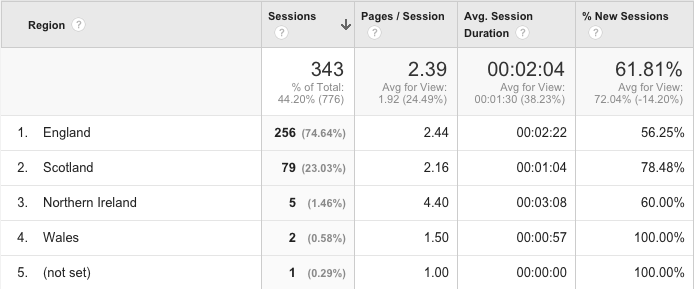
The data above demonstrate that the majority of Whites Writing Whiteness website users access the website from England (74.6%), Scotland (23%), and Northern Ireland (1.5%), and that users from Northern Ireland and England also tend to spend the most time on the website.
| Table 6: Cities, Number of Visits and Pages Accessed | ||||||
| The data below show, by city, the top numbers of visits, number of pages accessed on average and the average duration spent on the site, respectively. N.B. asterisks denote particularly intense site usage and/or high numbers of visits. | ||||||
| Country | City | Visits | Pages accessed | Avg. visit duration (mins) | ||
| UK
(10 of 50)
|
Oxford | 74* | 1.31 | 01:17 | ||
| Edinburgh | 67* | 2.18 | 01:05 | |||
| London | 48* | 1.92 | 00:27 | |||
| Leeds | 31* | 1.03 | 00:28 | |||
| Cambridge | 29* | 8.69* | 12:42* | |||
| Lancaster | 9 | 2.67* | 03:40* | |||
| Manchester | 7 | 1.43 | 00:07 | |||
| Aberdeen | 5 | 1.20 | 00:04 | |||
| Glasgow | 5 | 4.08* | 02:15 | |||
| Birmingham | 4 | 1.00 | 00:00 | |||
| USA
(10 of 55)
|
Durham | 11* | 1.00 | 00:00 | ||
| New York | 7* | 1.14 | 02:26* | |||
| Sewanee | 7* | 1.00 | 00:00 | |||
| State College | 6 | 2.83* | 01:04 | |||
| (not set) | 5 | 1.00 | 00:00 | |||
| Collegeville | 4 | 1.00 | 00:00 | |||
| Boston | 3 | 1.00 | 00:00 | |||
| Pasadena | 2 | 2.50* | 02:35* | |||
| Statesboro | 2 | 1.00 | 00:00 | |||
| Stillwater | 2 | 5.00* | 16:51* | |||
| Australia
(9 of 9)
|
Melbourne | 15* | 2.13* | 01:48* | ||
| Brisbane | 5 | 2.20* | 00:59 | |||
| Sydney | 4 | 1.25 | 00:03 | |||
| Cairns | 1 | 1.00 | 00:00 | |||
| Adelaide | 1 | 1.00 | 00:00 | |||
| Hobart | 1 | 1.00 | 00:00 | |||
| Central Coast | 1 | 1.00 | 00:00 | |||
| Gold Coast | 1 | 2.00* | 01:41* | |||
| Perth | 1 | 3.00* | 00:29 | |||
| South Africa
(10 of 21)
|
Cape Town | 29* | 1.86 | 01:29 | ||
| Johannesburg | 13* | 2.69* | 02:37* | |||
| Sandton | 9* | 1.44 | 06:05* | |||
| Pretoria | 5 | 1.60 | 00:10 | |||
| East London | 4 | 2.00* | 01:58 | |||
| Port Elizabeth | 4 | 1.75 | 00:50 | |||
| Stellenbosch | 4 | 1.50 | 02:57* | |||
| (not set) | 3 | 1.00 | 00:00 | |||
| Centurion | 3 | 2.00* | 02:16* | |||
| Midrand | 2 | 1.00 | 00:00 | |||
Last updated: 31 January 2016

![]()